Electrostatic potential maps
From Proteopedia
It is revealing to visualize the distribution of electrostatic charges, electrostatic potential, on molecular van der Waals surfaces. Most protein-protein and protein-ligand interactions are largely electrostatic in nature, via hydrogen bonds and ionic interactions. Their strengths are modulated by the nature of the solvent: pure water or high ionic strength aqueous solution[1]. Charged residues modulate enzyme efficiency over considerable distances[2]. Missing atoms or residues, nearly universal in empirical models, cause errors in the map. Therefore it is crucial to use a model without missing atoms, which could be an AlphaFold model. While exploring a structure in FirstGlance in Jmol, electrostatic potential maps can be generated with a few mouse clicks -- see instructions below.
Contents |
Gallery
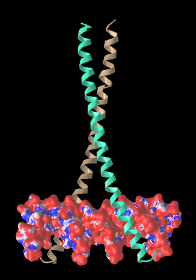
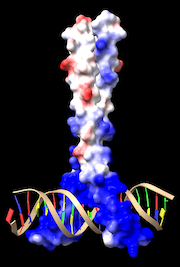
Leucine Zipper on DNA
| 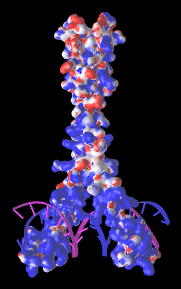
| Leucine zipper transcription regulator protein bound to DNA (5t01). 5t01 has only 5 missing residues, none charged, and 1 incomplete sidechain (Lys311), all at the ends of the protein chains. The electrostatic potential maps show positively charged protein surface contacting negatively charged DNA.
← Left maps generated via FirstGlance in Jmol using iCn3D, see below. | 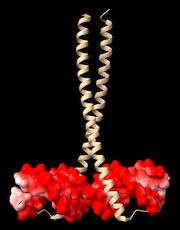
| 
|
Potassium Channel
| 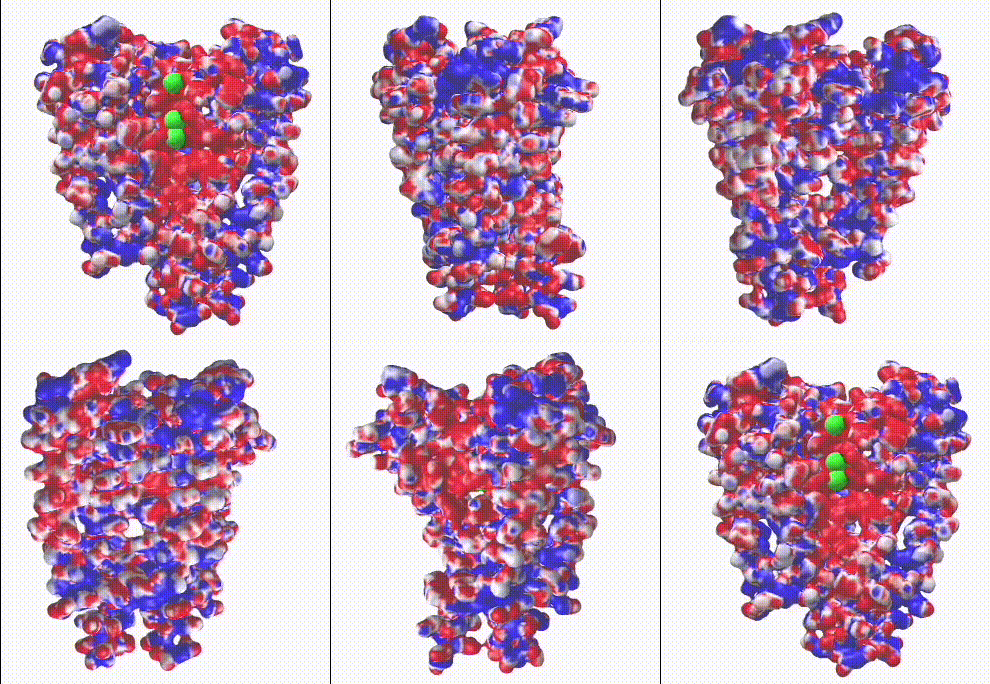
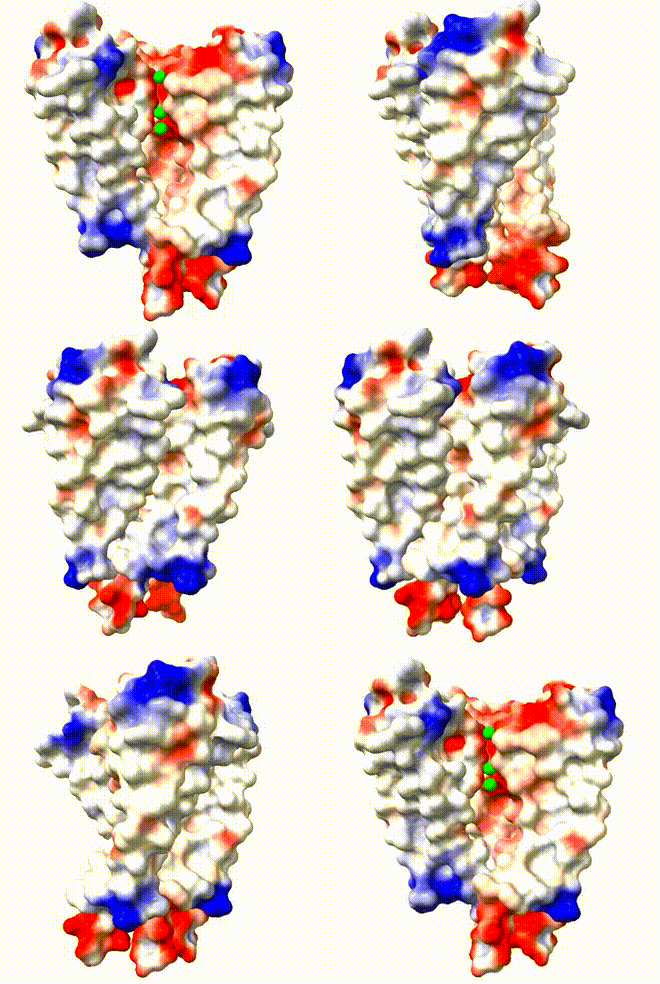
| Potassium channel (1bl8). The electrostatic potential map shows negatively charged protein surface lining the channel containing K+ ions.
←Left: Map generated by ChimeraX[3], see method. Right→: Map generated by iCn3D, see method. Map generated from a PDB file from which one of the 4 chains was removed with a plain text editor to reveal the inside surface of the channel. Caution: Map generated with 1bl8 which has, in each of the 3 chains, 3 Arginines and 1 Glutamic acid with incomplete sidechains. |
| 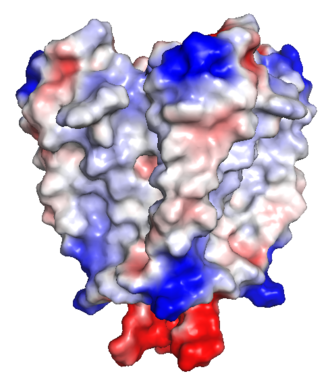
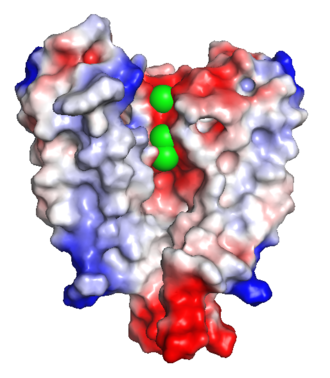
| Potassium channel (1bl8). The electrostatic potential map shows negatively charged protein surface lining the channel containing K+ ions.
Map generated by PyMOL, see method. Right→: Map generated by iCn3D, see method. Map generated from a PDB file from which one of the 4 chains was removed with a plain text editor to reveal the inside surface of the channel. Caution: Map generated with 1bl8 which has, in each of the 3 chains, 3 Arginines and 1 Glutamic acid with incomplete sidechains. |
Ribosome
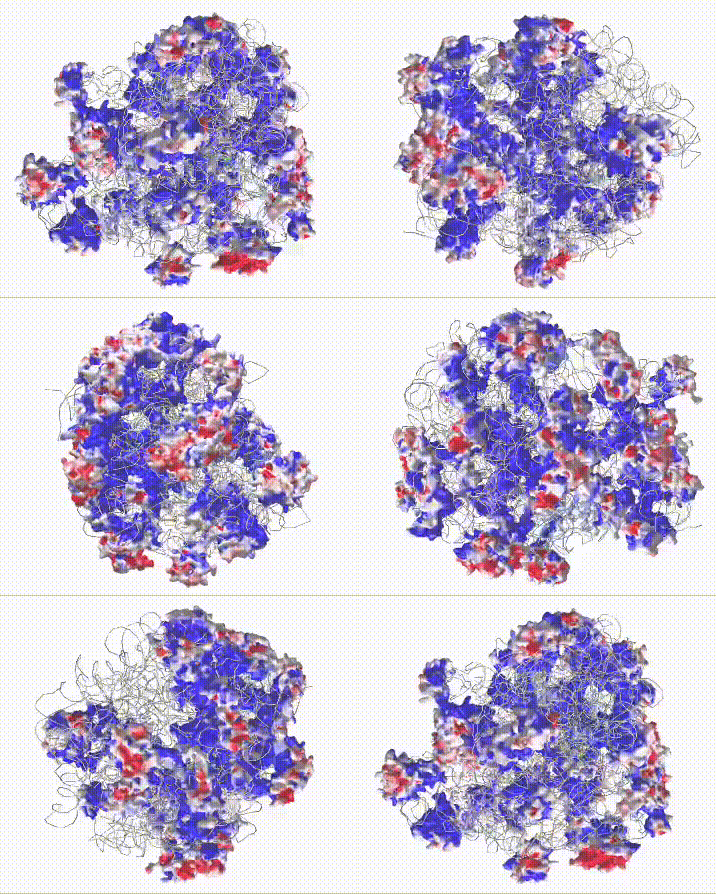
| Large ribosomal subunit (4ioa). The electrostatic potential maps of the many proteins show positively charged protein surfaces where protein contacts, or is buried within RNA (gray), while protein surfaces exposed to solvent have approximately net neutral mixtures of charges.
Map generated by iCn3D. Caution: Map generated with 4ioa, which has 162 amino acids modeled as alpha carbons only, and has 369 missing amino acids that include nearly 100 missing charged residues. |
Map Comparisons
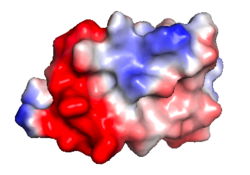
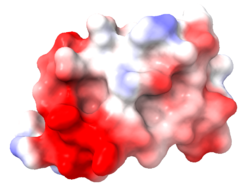
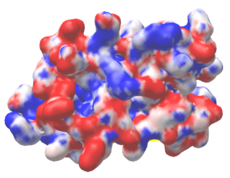
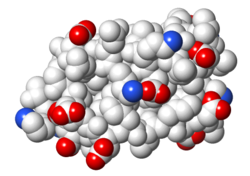
| Protein 1pgb (no missing atoms) is in the same orientation in all images. Positive + / Negative - | |||
|---|---|---|---|
| 
| 
| 
|
| Electrostatic potential map rendered by PyMOL using default molecular surface probe radius 1.4 Å. Method. | Electrostatic potential map rendered by ChimeraX. Method. | Electrostatic potential map rendered by iCn3D with "Potential contour" set to 4. Method. | Van der Waals model colored by charge with FirstGlance in Jmol. Sidechain nitrogens on Arg/Lys; oxygens on Asp/Glu. Method. |
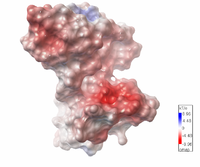
| Electrostatic potential map of 1tsj made with the Embedded Python Molecular Viewer from the Center for Computational Structural Biology of the Scripps Research Institute.
Click on the image to enlarge. |
Methods
iCn3D
iCn3D via FirstGlance in Jmol
- Start FirstGlance in Jmol.
- Enter the desired PDB Id, such as 5SZE.
- Click the Views tab, then click Show More Views.
- Click Electrostatic Potential Map.
- Click Protein or DNA/RNA[4]. iCn3D will open in a new browser tab showing the electrostatic potential map.
- Optionally, in iCn3D, Menu: Style, Background, White.
- To spin, iCn3D Menu: View, Rotate, Auto Rotation.
- See Capturing MOV or MP4 and converting to GIF.
In iCn3D
- Start the iCn3D web application.
- Enter the desired PDB Id, such as 1pgb, and click one of the Load buttons[4].
- Menu: Select, Defined Sets. In the list that appears, click on proteins (or optionally on nucleotices).
- Menu: Analysis, DelPhi Potential, DelPhi Potential. Click the Surface with Potential tab.
- Optional (to expand white regions), change Potential contour from 2 to a higher value.
- Click the button Surface with Potential.
- Menu (optional): Style, Background, White.
- To spin, Menu: View, Rotate, Auto Rotation.
- To remove the yellow selection halo, enter the command (in the slot at the bottom) "select sets nothing".
- See Capturing MOV or MP4 and converting to GIF.
ChimeraX
ChimeraX is free for non-commercial use.
- Download and install ChimeraX.
- Drag and drop a PDB file into ChimeraX, or use the File dropdown menu, Fetch by ID, PDB.
- Check the select checkbox (pointing finger icon) in the Models box (lower right) to select all, or use the Select dropdown menu to select a chain, or to select both chains C and D, enter the command "select /C,D".
- In the Molecule Display tab, click on electrostatic.
- After the surface appears, try the Lighting & Effects options in the Graphics tab.
- De-select with the checkbox in the Models box.
- To save an MP4 movie to the Desktop, click the Spin movie icon in the Home tab:

- See Converting MP4 to GIF.
PyMOL
PyMOL has a license fee, but is free for students and educators.
- Download and install PyMOL.
- Enter command "fetch 1pgb".
- The above command loads the asymmetric unit. Commands to load biological assembly 1:
- fetch 7mgp, type=pdb1
- split_state 7mgp
- Menu: All, Action, remove waters.
- Menu: 1pgb, Action, generate, vacuum electrostatics, protein contact potential (local). For a biological assembly, it appears that you will have to repeat this command for every part.
- Enter command "bg_color white".
Optional: The probe radius used to generate the molecular surface can be changed, and the previously generated surface will immediately change. The command is "set solvent_radius, 1.2" (don't overlook the comma!).
Converting MOV or MP4 to GIF
Please see at FirstGlance in Jmol: Video Capture & Conversion.
Coloring Charged Atoms
- Start FirstGlance in Jmol.
- Enter the desired PDB Id, such as 1ijw.
- Click the Views tab, then click Charge...
See Also
- Electrostatic interactions in Proteopedia.
- Jmol/Electrostatic potential methods.
- Isopotential Map in Wikipedia
- Delphi Web Server
References
- ↑ This opening paragraph was adapted from text authored by User:Karsten Theis in Jmol/Electrostatic potential.
- ↑ Zlobin A, Maslova V, Beliaeva J, Meiler J, Golovin A. Long-Range Electrostatics in Serine Proteases: Machine Learning-Driven Reaction Sampling Yields Insights for Enzyme Design. J Chem Inf Model. 2025 Feb 10. PMID:39928564 doi:10.1021/acs.jcim.4c01827
- ↑ Colors of the electrostatic potential map generated by ChimeraX were intensified by reducing the range from default -10 to 10 with the command "coulombic sel range -4,4".
- ↑ 4.0 4.1 To visualize the differences between the biological unit and asymmetric unit, view the PDB Id in http://firstglance.jmol.org, then click on Biological Unit 1.
