We apologize for Proteopedia being slow to respond. For the past two years, a new implementation of Proteopedia has been being built. Soon, it will replace this 18-year old system. All existing content will be moved to the new system at a date that will be announced here.
Sandbox3H04
From Proteopedia
(Difference between revisions)
(Undo revision 4332105 by Cameron Snelbaker (Talk)) |
|||
| (10 intermediate revisions not shown.) | |||
| Line 8: | Line 8: | ||
== Structure/Sequence Analysis == | == Structure/Sequence Analysis == | ||
| - | + | <StructureSection load='3H04' size='400' side='right' caption='PDB Structure of 3H04' scene=''> | |
'''Sequence Analysis''' | '''Sequence Analysis''' | ||
| Line 16: | Line 16: | ||
'''Chimera''' | '''Chimera''' | ||
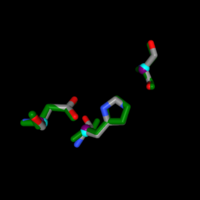
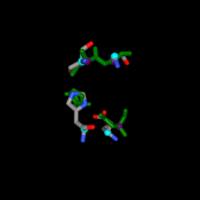
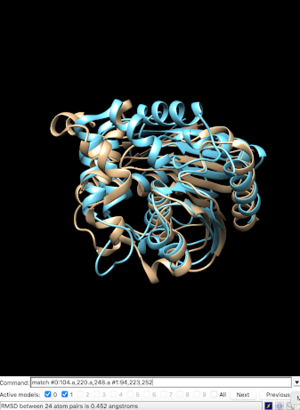
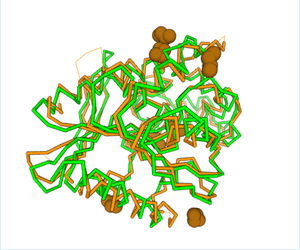
| - | The structural viewing program Chimera was used to view the specific amino acids from SPRITE in the theorized functional group. 1a8q was the primary match used to model matching | + | The structural viewing program Chimera was used to view the specific amino acids from SPRITE in the theorized functional group. 1a8q was the primary match used to model matching 3H04’s 104 serine at 1a8q’s 94, 220 aspartate at 223, and 248 histidine at 252 respectively with a RMSD of 0.452. An overlap was performed to view the functional alignment which can be viewed here.[[Image:ChimeraAlignmentBS.png |300px|center|thumb|]] |
'''BLAST''' | '''BLAST''' | ||
| Line 46: | Line 46: | ||
'''Overview''' | '''Overview''' | ||
| - | [[Image:Increasingplot.png|400px|center|thumb|]] | ||
| - | [[Image:Screenshot 2025-04-27 203045.png|400px|center|thumb|]] | ||
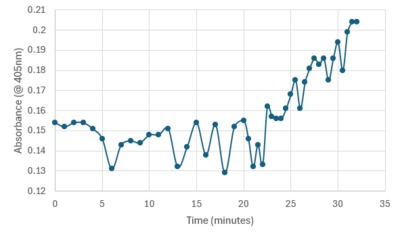
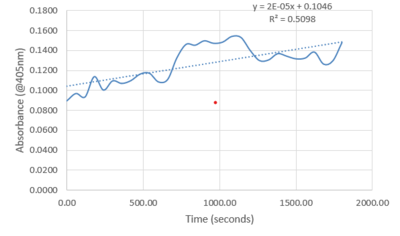
| - | Protein Purification was the first step in getting to a point of experimental data. The protein was grown in E. coli solution that had been tagged with an antibiotic resistance to isolate the protein. The pellet was then lysed with a buffer and sonicated to break up the sample. The resulting sample was centrifuged and the liquid was collected and placed into a separatory column to gather elutions. All steps had portions that were taken throughout to view where the protein was best concentrated. The first experimental occurred from a Bradford assay of known standards to determine which elution had the highest concentration of protein. (Graph to show elution 1 had highest amount). The second experiment was running the portions through all steps on an SDS-PAGE gel to view the purify and amount of protein. It was determined that the protein had expelled through the wash before the elutions were collected. (Include sds-page here) The wash was used to test enzymatic activity by adding PNPP, a buffer, and protein, then recording the absorbance for around 30 minutes. Testing showed a sharp increase in absorbance from 22 to 32 minutes meaning PNPP was cleaved to produce the increase in intensity. The experiment was run again at body temperature using a well plate reader with similar results but much higher increase in intensity. | + | Protein Purification was the first step in getting to a point of experimental data. The protein was grown in E. coli solution that had been tagged with an antibiotic resistance to isolate the protein. The pellet was then lysed with a buffer and sonicated to break up the sample. The resulting sample was centrifuged and the liquid was collected and placed into a separatory column to gather elutions. All steps had portions that were taken throughout to view where the protein was best concentrated. The first experimental occurred from a Bradford assay of known standards to determine which elution had the highest concentration of protein. (Graph to show elution 1 had highest amount). The second experiment was running the portions through all steps on an SDS-PAGE gel to view the purify and amount of protein. It was determined that the protein had expelled through the wash before the elutions were collected. (Include sds-page here) The wash was used to test enzymatic activity by adding PNPP, a buffer, and protein, then recording the absorbance for around 30 minutes. Testing showed a sharp increase in absorbance from 22 to 32 minutes meaning PNPP was cleaved to produce the increase in intensity. The resulting plot is shown below. |
| + | [[Image:Increasingplot.png|400px|center|thumb|]] | ||
| + | The experiment was run again at body temperature using a well plate reader with similar results but much higher increase in intensity. The resulting plot is shown below. | ||
| + | [[Image:Screenshot 2025-04-27 203045.png|400px|center|thumb|]] | ||
== Relevance == | == Relevance == | ||
Current revision
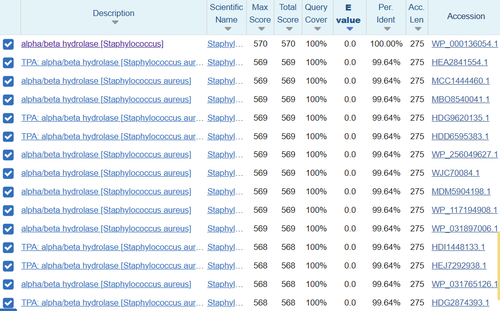
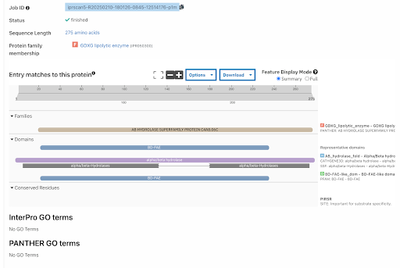
General Structure and Origins The total structure weighs 31.41 kDa and the atom count is 2,297. The protein 3H04 usually only occurs in bacteria, specifically staphylococcus aureus subsp. aureus Mu50. Each chain in the protein is about 275 residues long. Using InterPro, it can be seen that the protein is found in the alpha-beta hydrolase superfamily.
Family and Superfamily The family code was BD-FAE under the superfamily of alpha-beta hydrolase.
Structure/Sequence Analysis
| |||||||||||
References
3H04. Protein Database, 2009. https://www.rcsb.org/structure/3H04
