User:Enrico Ravera/Sandbox 1
From Proteopedia
| Line 15: | Line 15: | ||
== Case Study: [[Calmodulin]] == | == Case Study: [[Calmodulin]] == | ||
Calmodulin (in this case N60D Calmodulin<ref>PMID:12834353</ref>(PDB ENTRIES [[1sw8]],[[2k0j]],[[2k61]])) is a two-domain protein experiencing high mobility in the central region<ref>PMID:1606151</ref><ref>PMID:3365370</ref>. Paramagnetic NMR restraints as pseudocontact shift (PCS) and self-orientation residual dipolar couplings (RDC) provided further insight in the description of such conformational heterogeneity<ref>doi:10.1073/pnas.0308641101</ref> (PDB ENTRIES [[1sw8]],[[2k0j]],[[2k61]]). | Calmodulin (in this case N60D Calmodulin<ref>PMID:12834353</ref>(PDB ENTRIES [[1sw8]],[[2k0j]],[[2k61]])) is a two-domain protein experiencing high mobility in the central region<ref>PMID:1606151</ref><ref>PMID:3365370</ref>. Paramagnetic NMR restraints as pseudocontact shift (PCS) and self-orientation residual dipolar couplings (RDC) provided further insight in the description of such conformational heterogeneity<ref>doi:10.1073/pnas.0308641101</ref> (PDB ENTRIES [[1sw8]],[[2k0j]],[[2k61]]). | ||
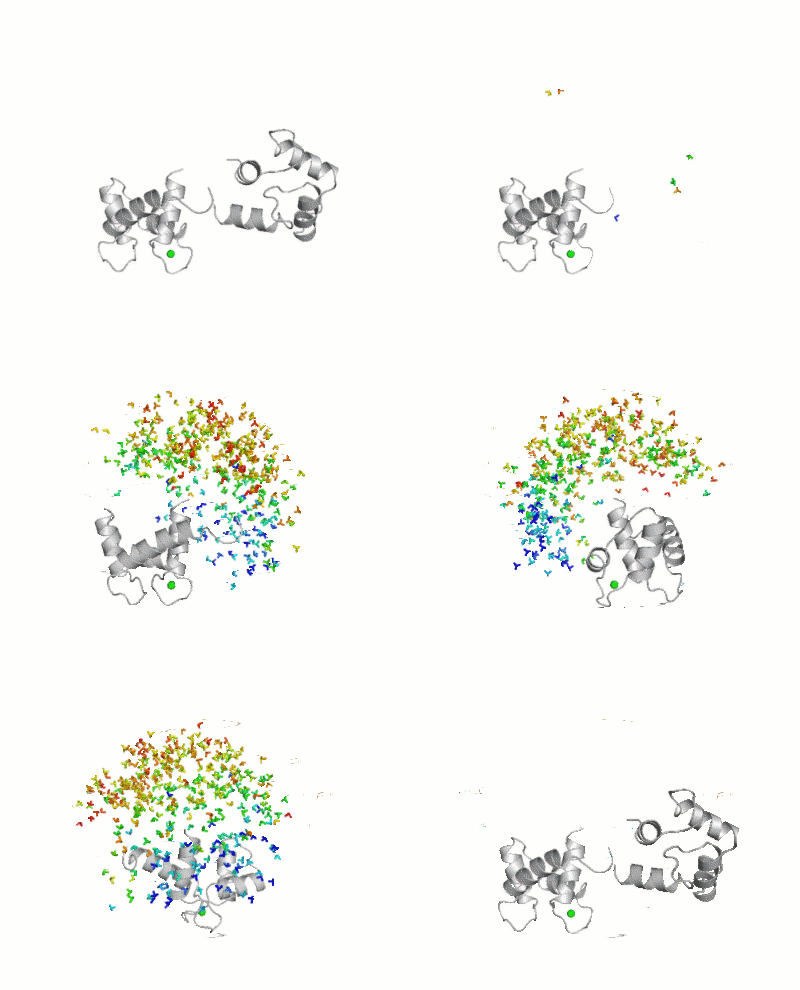
| - | [[Image:Movie_MOforproteopedia.gif|thumbnail|400px|Figure 3: Orientation tensor representation for 400 conformational states of Calmodulin, color coded according to their MO values (from | + | [[Image:Movie_MOforproteopedia.gif|thumbnail|400px|Figure 3: Orientation tensor representation for 400 conformational states of Calmodulin, color coded according to their MO values (from less than 5% in blue to more than 30% in red).To better explain their meaning, 10 randomly chosen models are shown as cartoon and then replaced by the three axes of their orientation tensor.]] |
For this study, 400 conformers were chosen randomly, with the only requisite to be sterically allowed and their maximum occurrence was evaluated against 3 sets of PCS (due to Tb<sup>3+</sup>,Dy<sup>3+</sup> and Tm<sup>3+</sup>) and 3 sets of RDC (from the same metals), both measured at * [http://www.cerm.unifi.it CERM (in Florence)], and X-rays scattering data up to 2nm<sup>-1</sup>, as recoded on the X33 beamline at [http://www.embl-hamburg.de/ExternalInfo/Research/Sax/ EMBL, DESY, Hamburg]. | For this study, 400 conformers were chosen randomly, with the only requisite to be sterically allowed and their maximum occurrence was evaluated against 3 sets of PCS (due to Tb<sup>3+</sup>,Dy<sup>3+</sup> and Tm<sup>3+</sup>) and 3 sets of RDC (from the same metals), both measured at * [http://www.cerm.unifi.it CERM (in Florence)], and X-rays scattering data up to 2nm<sup>-1</sup>, as recoded on the X33 beamline at [http://www.embl-hamburg.de/ExternalInfo/Research/Sax/ EMBL, DESY, Hamburg]. | ||
Results of the calculation is represented in figure 3: Orientation tensors, centered in the center of mass of the C-terminal domain, are shown color coded according to their MO value (from lesser than 5% in blue to higher than 30% in red). | Results of the calculation is represented in figure 3: Orientation tensors, centered in the center of mass of the C-terminal domain, are shown color coded according to their MO value (from lesser than 5% in blue to higher than 30% in red). | ||
Revision as of 08:54, 26 October 2010
Maximum Occurrence (MO) refers to a method for making rigorous numerical assessments about the probability of population of any conformation of a flexible biological macromolecules or of a complex. Maximum Occurrence of a conformer is defined as the maximum weight that it can have in one ensemble that matches the average experimental data.
Contents |
Background
Flexible proteins, even in the simplest case of two rigid domains linked by a flexible region, may sample a wide conformational space. Such variety makes their study by X-ray crystallography difficult, because it may yield the structure of a single conformation trapped in the crystal, if crystals are obtained at all. Solution techniques such as Nuclear Magnetic Resonance (NMR) and Small-Angle Scattering of both X-rays and Neutrons (SAXS and SANS), provide experimental observables averaged over many conformation with different weights.
The problem of recovering the conformational ensamble that generated the data from the data themselves is an ill-defined inverse problem that admits an infinite number of solutions.
Popular methods for the determination of mobility rely on the construction of ensembles that are solutions to this problem. Anyway, there is no proof that one solution can be better than another, so quantitative assessments are risky with these approaches.
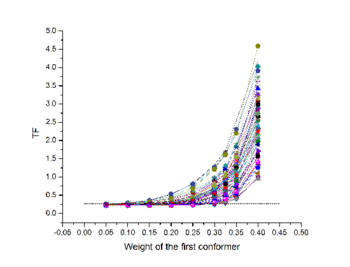
The Maximum Occurrence is the maximum percent of time that a conformer of a macromolecule can exist and still be compatible with the experimental data (see Figure 1). In this case, the quantitative assessment is rigorous, since only one conformer of the ensamble is considered while the completing conformers are not artificiallty endowed of physical relevance that they may not have.
Recently, an implementation of this method based on distributed computing was presented to evaluate the MO profiles for a big number of conformers[1]: this represents an evolution of a previous approach where few conformations having the maximum allowed probability (MAP) were looked for[2].
Methods for determination of Maximum Occurrence
As already mentioned, to evaluate the Maximum Occurrence, an ensemble is sought so that the conformation under investigation is contained up to a certain value. At the Maximum Occurrence, no solution will be found fulfilling both the requisites of containing the desired conformation and of being compatible with the experimental data. Such process is exemplified in figure 2: the four boxes represent 4 different ensembles, containing the desired conformation (represented as a red star) at different weight (represented by the dimension of the red star): the fourth one is no more compatible with the experimental data.
The Maximum Occurrence approach has been developed using mainly paramagnetism-based NMR restraints and SAXS data, but it is well compatible with all the biophysical tools providing experimental data that are averages over all the states sampled by the system.
Case Study: Calmodulin
Calmodulin (in this case N60D Calmodulin[3](PDB ENTRIES 1sw8,2k0j,2k61)) is a two-domain protein experiencing high mobility in the central region[4][5]. Paramagnetic NMR restraints as pseudocontact shift (PCS) and self-orientation residual dipolar couplings (RDC) provided further insight in the description of such conformational heterogeneity[6] (PDB ENTRIES 1sw8,2k0j,2k61).

For this study, 400 conformers were chosen randomly, with the only requisite to be sterically allowed and their maximum occurrence was evaluated against 3 sets of PCS (due to Tb3+,Dy3+ and Tm3+) and 3 sets of RDC (from the same metals), both measured at * CERM (in Florence), and X-rays scattering data up to 2nm-1, as recoded on the X33 beamline at EMBL, DESY, Hamburg. Results of the calculation is represented in figure 3: Orientation tensors, centered in the center of mass of the C-terminal domain, are shown color coded according to their MO value (from lesser than 5% in blue to higher than 30% in red).
Bibliography
- ↑ Bertini I, Giachetti A, Luchinat C, Parigi G, Petoukhov MV, Pierattelli R, Ravera E, Svergun DI. Conformational Space of Flexible Biological Macromolecules from Average Data. J Am Chem Soc. 2010 Sep 7. PMID:20822180 doi:10.1021/ja1063923
- ↑ Bertini I, Gupta YK, Luchinat C, Parigi G, Peana M, Sgheri L, Yuan J. Paramagnetism-based NMR restraints provide maximum allowed probabilities for the different conformations of partially independent protein domains. J Am Chem Soc. 2007 Oct 24;129(42):12786-94. Epub 2007 Oct 2. PMID:17910448 doi:10.1021/ja0726613
- ↑ Bertini I, Gelis I, Katsaros N, Luchinat C, Provenzani A. Tuning the affinity for lanthanides of calcium binding proteins. Biochemistry. 2003 Jul 8;42(26):8011-21. PMID:12834353 doi:10.1021/bi034494z
- ↑ Barbato G, Ikura M, Kay LE, Pastor RW, Bax A. Backbone dynamics of calmodulin studied by 15N relaxation using inverse detected two-dimensional NMR spectroscopy: the central helix is flexible. Biochemistry. 1992 Jun 16;31(23):5269-78. PMID:1606151
- ↑ Heidorn DB, Trewhella J. Comparison of the crystal and solution structures of calmodulin and troponin C. Biochemistry. 1988 Feb 9;27(3):909-15. PMID:3365370
- ↑ Bertini I, Del Bianco C, Gelis I, Katsaros N, Luchinat C, Parigi G, Peana M, Provenzani A, Zoroddu MA. Experimentally exploring the conformational space sampled by domain reorientation in calmodulin. Proc Natl Acad Sci U S A. 2004 May 4;101(18):6841-6. Epub 2004 Apr 20. PMID:15100408 doi:10.1073/pnas.0308641101


