Journal:IUCrJ:S205225252000072X
From Proteopedia
(Difference between revisions)

| Line 13: | Line 13: | ||
{{Clear}} | {{Clear}} | ||
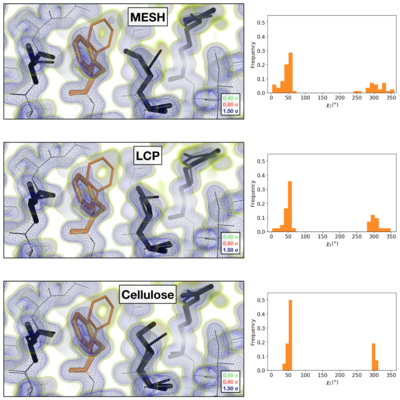
Comparison of the 2mFoFc map and the refined multi-conformer model produced from each serial XFEL experiment. Maps were visualized at multiple contour levels to show evidence for alternative conformations (see static image above). Following multi-conformer refinement, ensembles were generated from each model using phenix.ensemble_refine. In the right panel, a histogram of the Chi1 angles for residue 113 is plotted for the ensemble. Multi-conformer models plus maps, and the distribution of Chi1 angles across the ensemble models are similar for all three XFEL data sets: | Comparison of the 2mFoFc map and the refined multi-conformer model produced from each serial XFEL experiment. Maps were visualized at multiple contour levels to show evidence for alternative conformations (see static image above). Following multi-conformer refinement, ensembles were generated from each model using phenix.ensemble_refine. In the right panel, a histogram of the Chi1 angles for residue 113 is plotted for the ensemble. Multi-conformer models plus maps, and the distribution of Chi1 angles across the ensemble models are similar for all three XFEL data sets: | ||
| - | *<scene name='83/834718/Cv/2'>XFEL MESH</scene>. | + | *<scene name='83/834718/Cv/2'>XFEL MESH</scene> ([[6u5c]]). |
| - | *<scene name='83/834718/Cv/3'>XFEL LCP</scene>. | + | *<scene name='83/834718/Cv/3'>XFEL LCP</scene> ([[6u5d]]). |
| - | *<scene name='83/834718/Cv/4'>XFEL Cellulose</scene> | + | *<scene name='83/834718/Cv/4'>XFEL Cellulose</scene> ([[6u5e]]). |
[[Image:fig4_alt_revised.001.png|left|400px|thumb]] | [[Image:fig4_alt_revised.001.png|left|400px|thumb]] | ||
{{Clear}} | {{Clear}} | ||
Visualization of the 2mFoFc map and the refined model measured from a FIB-milled crystal using MicroED (see static image above). The conformation of residues coupled to the catalytic site resembles structures previously solved under cryogenic conditions using X-ray crystallography (PDB ID [[3k0m]]). For some regions of the structure, the cryogenic X-ray and MicroED structures are indistinguishable. A previously published multi-conformer model produced from data acquired at room temperature is provided for comparison (PDB ID [[3k0n]]). Following refinement, ensembles were generated using phenix.ensemble_refine. In the right panel, a histogram of the Chi1 angles for residue 113 is plotted for the ensemble. All members of the ensemble adopted the same rotameric position as previous cryogenic structures. | Visualization of the 2mFoFc map and the refined model measured from a FIB-milled crystal using MicroED (see static image above). The conformation of residues coupled to the catalytic site resembles structures previously solved under cryogenic conditions using X-ray crystallography (PDB ID [[3k0m]]). For some regions of the structure, the cryogenic X-ray and MicroED structures are indistinguishable. A previously published multi-conformer model produced from data acquired at room temperature is provided for comparison (PDB ID [[3k0n]]). Following refinement, ensembles were generated using phenix.ensemble_refine. In the right panel, a histogram of the Chi1 angles for residue 113 is plotted for the ensemble. All members of the ensemble adopted the same rotameric position as previous cryogenic structures. | ||
| - | *<scene name='83/834718/Cv/ | + | *<scene name='83/834718/Cv/7'>The refined model measured from a FIB-milled crystal using MicroED</scene> ([[6u5g]] colored in magenta). [[3k0n]] (room temp X-ray) is in orange and [[3k0m]] (cryo X-ray) is in deepskyblue. |
<b>References</b><br> | <b>References</b><br> | ||
<references/> | <references/> | ||
</StructureSection> | </StructureSection> | ||
__NOEDITSECTION__ | __NOEDITSECTION__ | ||
Revision as of 12:25, 3 February 2020
| |||||||||||
This page complements a publication in scientific journals and is one of the Proteopedia's Interactive 3D Complement pages. For aditional details please see I3DC.


