This old version of Proteopedia is provided for student assignments while the new version is undergoing repairs. Content and edits done in this old version of Proteopedia after March 1, 2026 will eventually be lost when it is retired in about June of 2026.
Apply for new accounts at the new Proteopedia. Your logins will work in both the old and new versions.
Image:Kinase bradford graph.PNG
From Proteopedia
(Difference between revisions)
No higher resolution available.
Kinase_bradford_graph.PNG (523 × 264 pixel, file size: 35 KB, MIME type: image/png)
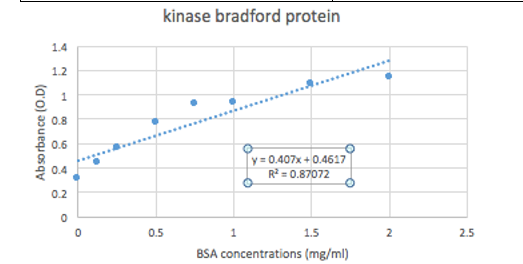
(This is a graph of the bradford concentrations. The results for the bradford concentration was 1.1408 mg/ml.) |
(This is a graph of the bradford concentrations. The results for the bradford concentration was 1.1408 mg/ml.) |
Current revision
Summary
This is a graph of the bradford concentrations. The results for the bradford concentration was 1.1408 mg/ml.
Licensing
{{subst:No license from license selector|Don't know}}
File history
Click on a date/time to view the file as it appeared at that time.
| Date/Time | User | Dimensions | File size | Comment | |
|---|---|---|---|---|---|
| (current) | 17:30, 19 April 2023 | Carmen Almendarez Rodriguez (Talk | contribs) | 523×264 | 35 KB | This is a graph of the bradford concentrations. The results for the bradford concentration was 1.1408 mg/ml. |
- Edit this file using an external application
See the setup instructions for more information.
Links
There are no pages that link to this file.
