User:Francielle Aguiar Gomes/Sandbox 1
From Proteopedia
(Difference between revisions)
| Line 12: | Line 12: | ||
== Cryo-EM == | == Cryo-EM == | ||
| - | Cryogenic electron microscopy (cryo-EM) is a cryomicroscopy technique applied to samples cooled to cryogenic temperatures. For biological samples, structure is preserved by embedding in a glassy ice environment. An aqueous sample is applied to a mesh grid and frozen by immersion in liquid ethane or a mixture of liquid ethane and propane <ref>10.1017/S1431927608080781</ref>. This technique has advanced dramatically to become a viable tool for high-resolution structural biology research. The ultimate outcome of a cryoEM study is an atomic model of a macromolecule or its complex with interacting partners. | + | Cryogenic electron microscopy (cryo-EM) is a cryomicroscopy technique applied to samples cooled to cryogenic temperatures. For biological samples, structure is preserved by embedding in a glassy ice environment. An aqueous sample is applied to a mesh grid and frozen by immersion in liquid ethane or a mixture of liquid ethane and propane <ref>10.1017/S1431927608080781</ref>. This technique has advanced dramatically to become a viable tool for high-resolution structural biology research. The ultimate outcome of a cryoEM study is an atomic model of a macromolecule or its complex with interacting partners. Recent advances in direct electron detectors as well as reconstruction single particle algorithms have led to the determination of the structure of macromolecular complexes ranging from 2 to 5 Å resolution. At these resolutions, also known as “near atomic” resolution, it is possible to infer all-atom structures de novo. |
| + | The first step in cryoEM structure determination is de novo structure determination, where an initial model can be built, given only one sequence and a reconstruction, when no other limited structural information is known. In the second stage, the model is optimized, where a wide range of class of methods for improving the fit of a model to the data and improving the geometry of a model. Finally, tools for model validation are described, in attempt to quantify the overall accuracy of a model given a reconstruction. | ||
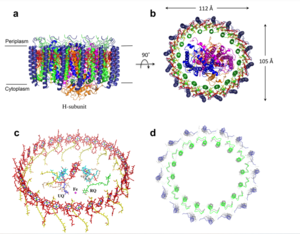
| + | [[Image:Structure.png|300px|left|thumb| Structure overview of the Rsp. rubrum LH1-RC complex. (a) Side view of the LH1-RC parallel to the membrane plane. (b) Top view of the LH1-RC from the periplasmic side of the membrane. (c) Tilted view of the cofactor arrangement. (d) Superposition of Cα carbons of the LH1 αβpolypeptides between Rsp. rubrum and Tch. tepidum (gray, PDB: 5Y5S). Color scheme: LH1-α, green; LH1-β, slate-blue; L-subunit, magenta; Msubunit, blue; BChl aG in LH1 and special pair, red sticks; Accessory BChl aG, cyan sticks; BPhe aG, light-pink sticks; Spirilloxanthin, yellow sticks; UQ10, blue sticks; RQ-10, green sticks; Fe, magenta ball. Phospholipids and detergents are omitted for clarity]] | ||
== Structure of Photosynthetic LH1-RC Super-complex of ''Rhodospirillum rubrum'' == | == Structure of Photosynthetic LH1-RC Super-complex of ''Rhodospirillum rubrum'' == | ||
Revision as of 17:40, 8 June 2023
Photosynthetic LH1-RC Super-complex of Rhodospirillum rubrum
| |||||||||||

