Electrostatic potential maps
From Proteopedia
(Difference between revisions)
(→Gallery) |
(→Gallery) |
||
| Line 4: | Line 4: | ||
{| class="wikitable" | {| class="wikitable" | ||
|- | |- | ||
| - | ! scope="colgroup" colspan="3" | Protein [[1pgb]] is in the same orientation in all images. | + | ! scope="colgroup" colspan="3" | Protein [[1pgb]] is in the same orientation in all images. '''{{Font color|blue|Positive +}}''' '''{{Font color|red|Negative -}}''' |
|- | |- | ||
|style="width: 250;" width="250"| [[Image:1pgb-EPM-PyMOL.png|250 px]] | |style="width: 250;" width="250"| [[Image:1pgb-EPM-PyMOL.png|250 px]] | ||
Revision as of 18:13, 25 August 2024
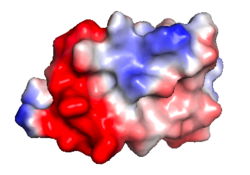
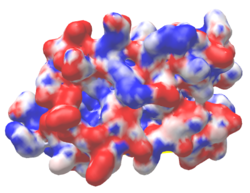
It is revealing to visualize the distribution of electrostatic charges, electrostatic potential, on molecular surfaces. Most protein-protein and protein-ligand interactions are largely electrostatic in nature, via hydrogen bonds and ionic interactions. Their strengths are modulated by the nature of the solvent: pure water or high ionic strength aqueous solution.
Gallery
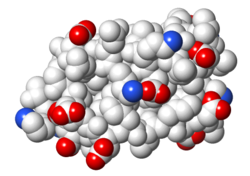
| Protein 1pgb is in the same orientation in all images. Positive + Negative - | ||
|---|---|---|

| 
| 
|
| Electrostatic potential map rendered by PyMOL. | Electrostatic potential map rendered by iCn3D. | Van der Waals model colored by charge wtih FirstGlance in Jmol. |
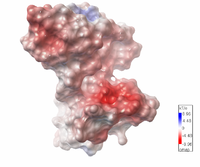
 | Electrostatic potential map of 1tsj made with the Embedded Python Molecular Viewer from the Center for Computational Structural Biology of the Scripps Research Institute. |
Click on the image to enlarge. |}
See Also
- Electrostatic interactions in Proteopedia.
- Jmol/Electrostatic potential methods.
- Isopotential Map in Wikipedia
- Delphi Web Server
