Journal:Acta Cryst D:S2059798325007089
From Proteopedia
(Difference between revisions)

| Line 15: | Line 15: | ||
|- | |- | ||
|- | |- | ||
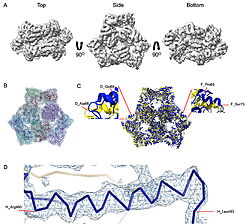
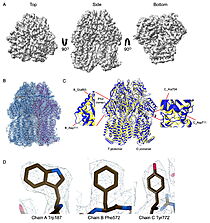
| - | | [[Image:022_Fig2.jpg|thumb|left|250px|Cryo-EM density map and model fitting of the hexameric ArnA complex. (a) Cryo-EM density map of the ArnA hexamer reconstructed at 4.0 Å resolution, shown from three orientations: top, side, and bottom views. The map reveals the characteristic two-layered architecture of ArnA and clearly resolved secondary-structure elements. (b) Final atomic model of ArnA fitted into the cryo-EM density map. Each of the 12 subunits is displayed in a different color to illustrate the hexameric arrangement. (c) Structural alignment of the final cryo-EM model (blue) with the reference crystal structure (yellow) using ChimeraX. The alignment yielded an rmsd of 1.2 Å. Enlarged views show local conformational deviations in loop regions: Glu69–Ala98 in chain D (left) and Pro65–Ser75 in chain F (right). (d) Close-up view showing the model-to-map fit for a peptide segment (Leu483–Arg460). The density mesh is contoured at 1.7 , showing clear peptide backbone density and supporting accurate model placement.]] [[Image:022_Fig3.jpg|thumb|right|210px| | + | | [[Image:022_Fig2.jpg|thumb|left|250px|Cryo-EM density map and model fitting of the hexameric ArnA complex. (a) Cryo-EM density map of the ArnA hexamer reconstructed at 4.0 Å resolution, shown from three orientations: top, side, and bottom views. The map reveals the characteristic two-layered architecture of ArnA and clearly resolved secondary-structure elements. (b) Final atomic model of ArnA fitted into the cryo-EM density map. Each of the 12 subunits is displayed in a different color to illustrate the hexameric arrangement. (c) Structural alignment of the final cryo-EM model (blue) with the reference crystal structure (yellow) using ChimeraX. The alignment yielded an rmsd of 1.2 Å. Enlarged views show local conformational deviations in loop regions: Glu69–Ala98 in chain D (left) and Pro65–Ser75 in chain F (right). (d) Close-up view showing the model-to-map fit for a peptide segment (Leu483–Arg460). The density mesh is contoured at 1.7 , showing clear peptide backbone density and supporting accurate model placement.]] [[Image:022_Fig3.jpg|thumb|right|210px|Cryo-EM density map and model fitting of the AcrB trimer. (a) Cryo-EM density map of AcrB reconstructed at 2.92 Å resolution, shown from top, side and bottom views. The map reveals clear secondary-structure elements and well-resolved transmembrane helices, consistent with the known trimeric architecture. (b) Final atomic model of AcrB fitted into the cryo-EM density map. Each protomer is rendered in a different color to highlight the asymmetric trimer organization. (c) Structural alignment of the final cryo-EM model (blue) with the reference crystal structure (PDB ID [[7rr7]], yellow), performed using ChimeraX. The r.m.s.d. between the two structures is 1.2 Å. Enlarged views highlight local conformational deviations, including Glu693–Asp711 in protomer B (left) and Ala704–Asp711 in protomer C (right), located within the PN2 subdomain. (d) Close-up view showing the density fit for selected side chains (Trp187 in chain A, Phe572 in chain B, Tyr772 in chain C). The mesh is contoured at 1.6 in Coot, showing well-defined density for aromatic residues.]] |
|} | |} | ||
Revision as of 08:00, 18 September 2025
| |||||||||||
This page complements a publication in scientific journals and is one of the Proteopedia's Interactive 3D Complement pages. For aditional details please see I3DC.


