This old version of Proteopedia is provided for student assignments while the new version is undergoing repairs. Content and edits done in this old version of Proteopedia after March 1, 2026 will eventually be lost when it is retired in about June of 2026.
Apply for new accounts at the new Proteopedia. Your logins will work in both the old and new versions.
Image:Enolase kinetics.jpeg
From Proteopedia
(Difference between revisions)
Size of this preview: 474 × 599 pixels
Full resolution (491 × 621 pixel, file size: 19 KB, MIME type: image/jpeg)
Cory Tiedeman (Talk | contribs)
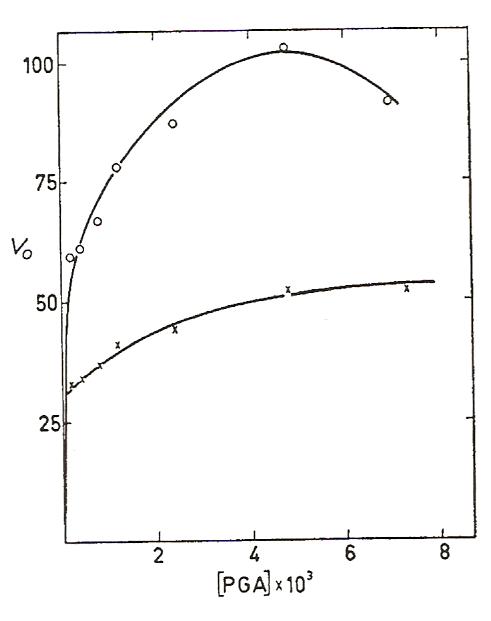
(Shows the V vs. [S] graph of enolase with two different concentrations of Mg2+. The substrate, PGA, is actually 2-PG. The upper curve has an Mg2+ concentration of 10^-3 M and the lower curve has an Mg2+ concentration of 10^-2 M.)
Next diff →
Revision as of 21:11, 23 March 2010
Shows the V vs. [S] graph of enolase with two different concentrations of Mg2+. The substrate, PGA, is actually 2-PG. The upper curve has an Mg2+ concentration of 10^-3 M and the lower curve has an Mg2+ concentration of 10^-2 M.
File history
Click on a date/time to view the file as it appeared at that time.
| Date/Time | User | Dimensions | File size | Comment | |
|---|---|---|---|---|---|
| (current) | 21:11, 23 March 2010 | Cory Tiedeman (Talk | contribs) | 491×621 | 19 KB | Shows the V vs. [S] graph of enolase with two different concentrations of Mg2+. The substrate, PGA, is actually 2-PG. The upper curve has an Mg2+ concentration of 10^-3 M and the lower curve has an Mg2+ concentration of 10^-2 M. |
- Edit this file using an external application
See the setup instructions for more information.
Links
The following pages link to this file:
