This old version of Proteopedia is provided for student assignments while the new version is undergoing repairs. Content and edits done in this old version of Proteopedia after March 1, 2026 will eventually be lost when it is retired in about June of 2026.
Apply for new accounts at the new Proteopedia. Your logins will work in both the old and new versions.
Image:Enzyme cascade.jpg
From Proteopedia
No higher resolution available.
Enzyme_cascade.jpg (789 × 560 pixel, file size: 34 KB, MIME type: image/jpeg)
Amy Chahal (Talk | contribs)
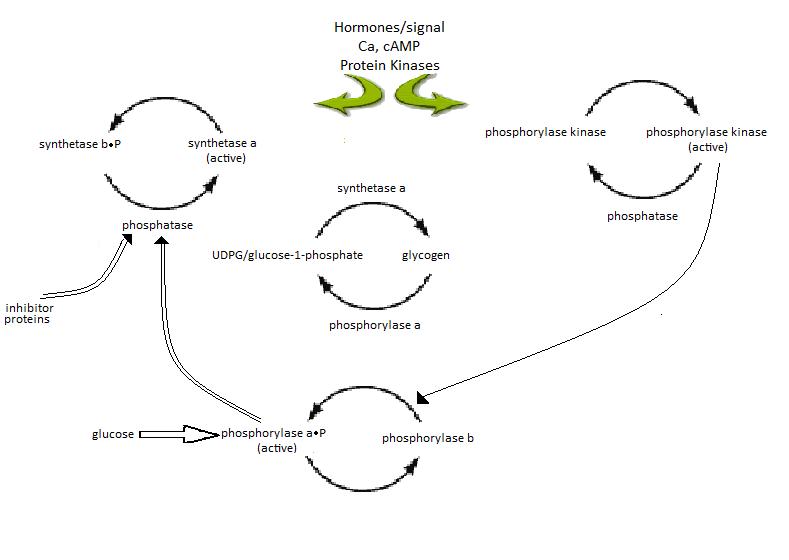
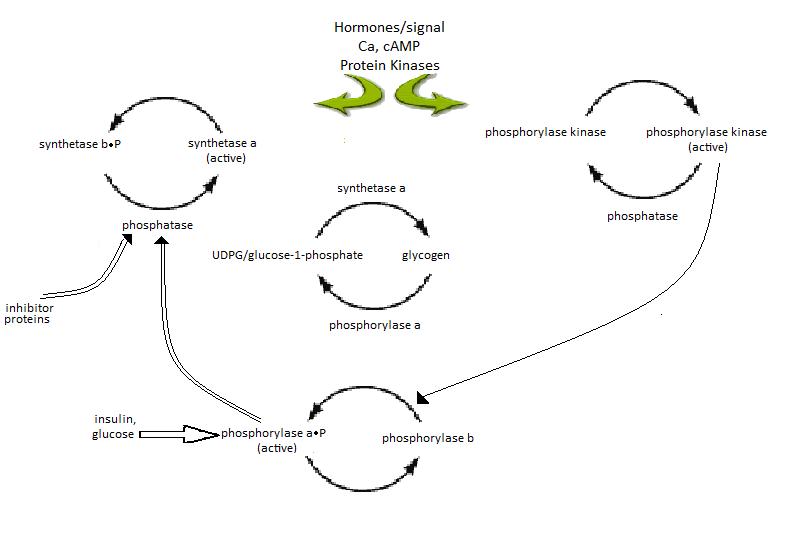
(Figure 1: Diagram illustrating the enzyme cascade that occurs when hormones(and neural signals)catalyze the activation of phosphorylase through kinase activity and thus inactivating glycogen synthetase. Phosphatases inactivate phosphorylase and is regulat)
Next diff →
Revision as of 08:55, 30 March 2010
Figure 1: Diagram illustrating the enzyme cascade that occurs when hormones(and neural signals)catalyze the activation of phosphorylase through kinase activity and thus inactivating glycogen synthetase. Phosphatases inactivate phosphorylase and is regulated by phosphorylase itself as well as inhibitor proteins. High glucose concentratios also lead to the inactivation of phosphorylase (inactivation represented by open arrows). Diagram adapted from (Ref).
File history
Click on a date/time to view the file as it appeared at that time.
| Date/Time | User | Dimensions | File size | Comment | |
|---|---|---|---|---|---|
| (current) | 09:26, 30 March 2010 | Amy Chahal (Talk | contribs) | 789×560 | 34 KB | Figure 1: Diagram illustrating the enzyme cascade that occurs when hormones(and neural signals)catalyze the activation of phosphorylase through kinase activity and thus inactivating glycogen synthetase. Phosphatases inactivate phosphorylase and is regulat |
| 08:55, 30 March 2010 | Amy Chahal (Talk | contribs) | 789×560 | 34 KB | Figure 1: Diagram illustrating the enzyme cascade that occurs when hormones(and neural signals)catalyze the activation of phosphorylase through kinase activity and thus inactivating glycogen synthetase. Phosphatases inactivate phosphorylase and is regulat |
- Edit this file using an external application
See the setup instructions for more information.
Links
The following pages link to this file:
