This old version of Proteopedia is provided for student assignments while the new version is undergoing repairs. Content and edits done in this old version of Proteopedia after March 1, 2026 will eventually be lost when it is retired in about June of 2026.
Apply for new accounts at the new Proteopedia. Your logins will work in both the old and new versions.
X-ray crystallography
From Proteopedia
m (fixed dead link to Nature of Structure Data at PDB with a link at that site that seems to be similar content) |
m (added link to page about hydrogens in structure models) |
||
| Line 26: | Line 26: | ||
*[[R value]] | *[[R value]] | ||
*[[Free R]] | *[[Free R]] | ||
| + | *[[Hydrogen in macromolecular models]] | ||
| Line 32: | Line 33: | ||
*[[NMR Ensembles of Models]] | *[[NMR Ensembles of Models]] | ||
| + | |||
==Further Reading== | ==Further Reading== | ||
Revision as of 16:45, 30 January 2011

|
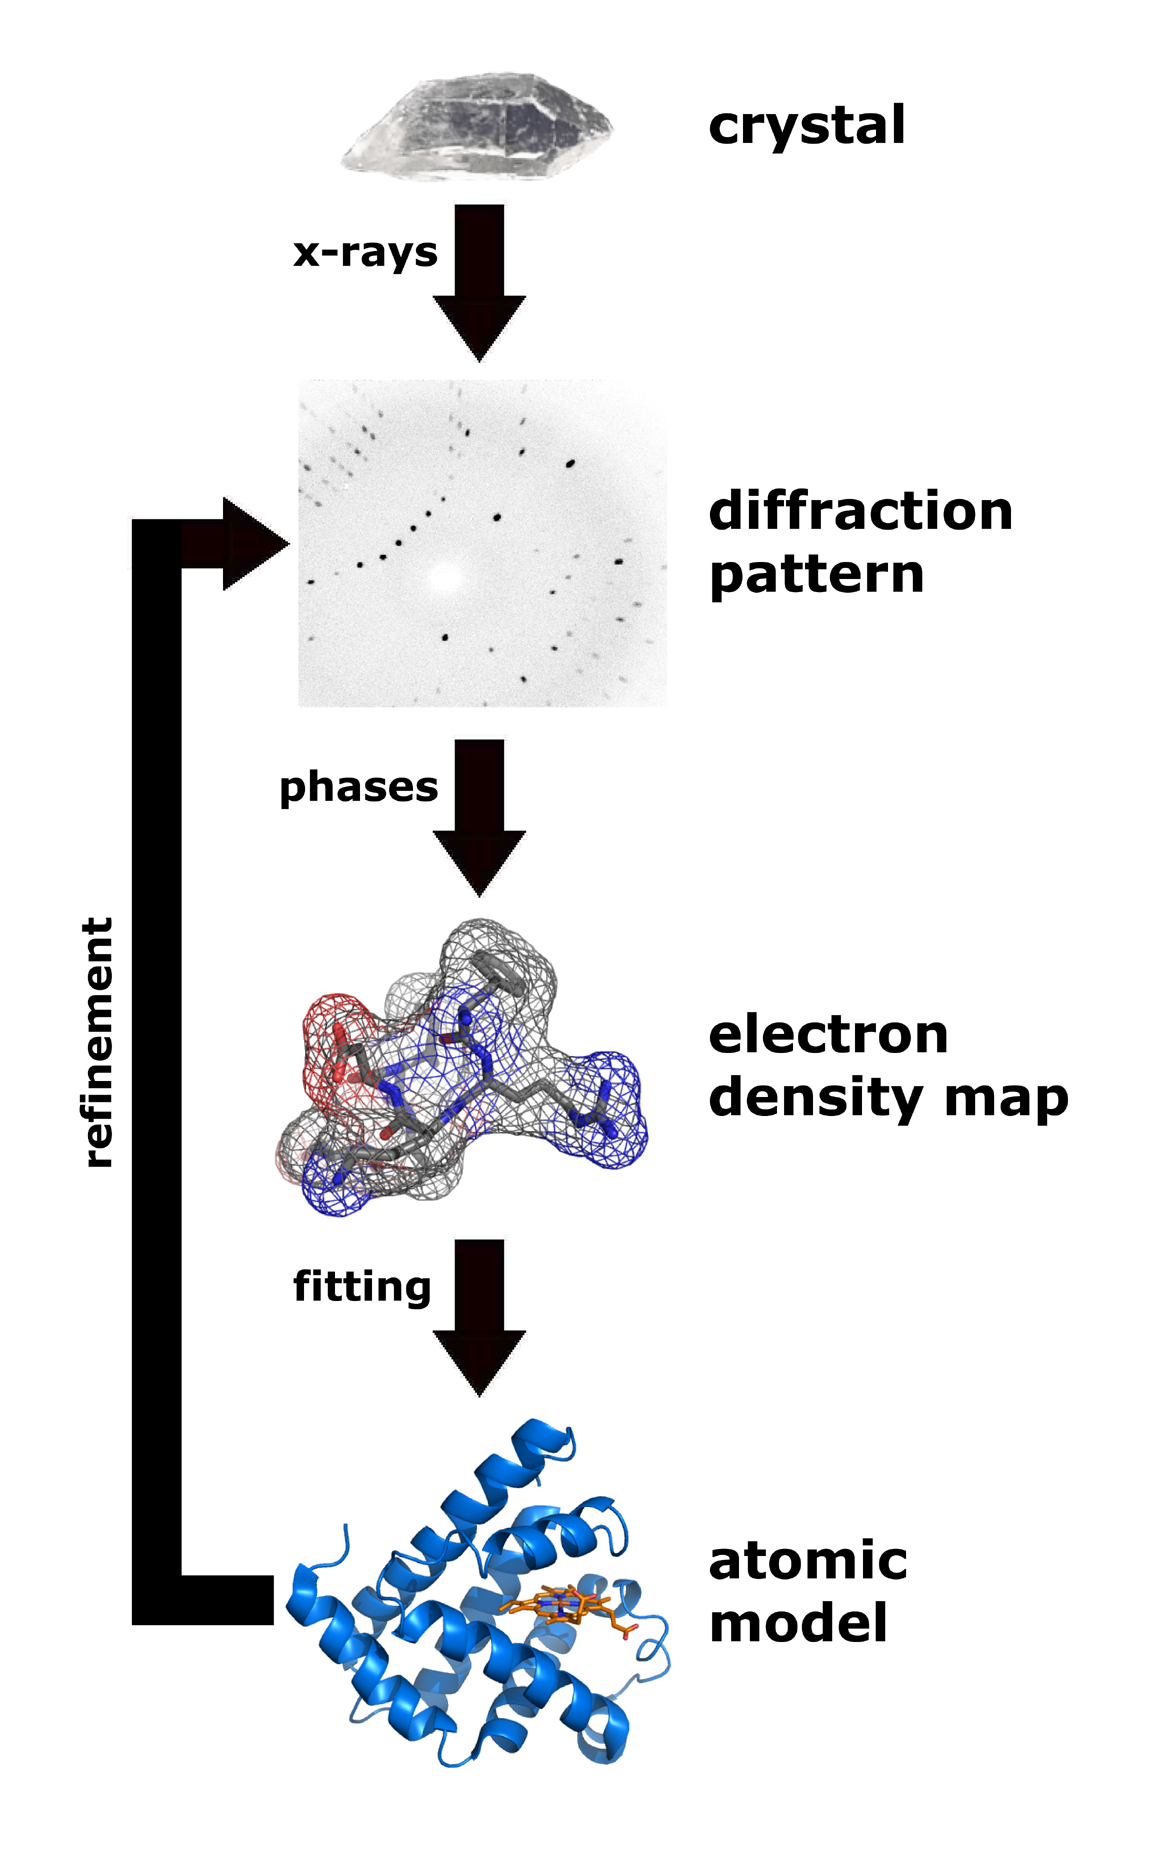
| Flow chart showing the major steps in X-ray protein crystallography. (Image from Wikimedia courtesy Thomas Splettstoesser. |
About 85% of the models (entries) in the World Wide Protein Data Bank were determined by X-ray crystallography. (Most of the remaining 15% were determined by solution nuclear magnetic resonance.) Analysis of x-ray diffraction patterns from protein crystals produces an electron density map, into which an atomic model of the protein is fitted. Major errors sometimes occur when fitting models in to low-resolution electron density maps (see Quality assessment for molecular models). The value of Free R is the best clue as to whether major errors may be present in a published model.
Obtaining diffraction-quality crystals of proteins remains very difficult, despite many recent advances. For every new protein sequence targeted for X-ray crystallography, about one in twenty is solved[1][2].
Publication of solved structures involves depositing an atomic coordinate file (PDB file) in the World Wide Protein Data Bank.
See Also
- Methods for Determining Atomic Structures
- X-ray Crystallography at Wikipedia
- Protein Crystal Gallery
- Crystal contacts
- Biological Unit
Further Reading
- Crystallography Made Crystal Clear: a guide for users of macromolecular models, a book by Gale Rhodes.
