Ramachandran Plot
From Proteopedia
m (The definitions of phi and psi angles were interchanged. This was corrected.) |
|||
| Line 6: | Line 6: | ||
<StructureSection load='' size='450' pspeed='8' side='right' scene='Ramachandran_Plots/Plot_1rnh/2' caption=''> | <StructureSection load='' size='450' pspeed='8' side='right' scene='Ramachandran_Plots/Plot_1rnh/2' caption=''> | ||
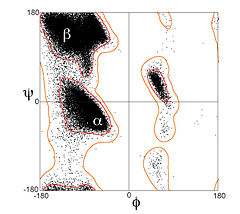
[[Image:Ramachandran plot general 100K.jpg|thumb|left|240px|Ramachandran plot and contours from 100,000 high-quality general-case datapoints]] | [[Image:Ramachandran plot general 100K.jpg|thumb|left|240px|Ramachandran plot and contours from 100,000 high-quality general-case datapoints]] | ||
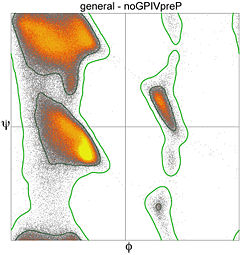
| - | The Ramachandran plot is a plot of the torsional angles - [[Psi_and_Phi_Angles|phi (φ)and psi (ψ)]] - of the residues (amino acids) contained in a peptide. In sequence order, φ is the | + | The Ramachandran plot is a plot of the torsional angles - [[Psi_and_Phi_Angles|phi (φ)and psi (ψ)]] - of the residues (amino acids) contained in a peptide. In sequence order, φ is the C(i),Ca(i),N(i),C(i+1) torsion angle and ψ is the N(i-1),C(i),Ca(i),N(i) torsion angle. The plot was developed in 1963 by G. N. Ramachandran, et. al.<ref>Ramachandran GN, Ramakrishnan C, Sasisekharan V (July 1963). "Stereochemistry of polypeptide chain configurations". J. Mol. Biol. 7: 95–9. PMID 13990617</ref> by plotting the φ values on the x-axis and the ψ values on the y-axis, as for the image at left<ref>doi:10.1002/prot.10286</ref>. Plotting the torsional angles in this way graphically shows which combination of angles are possible. The torsional angles of each residue in a peptide define the geometry of its attachment to its two adjacent residues by positioning its planar peptide bond relative to the two adjacent planar peptide bonds, thereby the torsional angles determine the conformation of the residues and the peptide. Many of the angle combinations, and therefore the conformations of residues, are not possible because of steric hindrance. By making a Ramachandran plot, protein structural scientists can determine which torsional angles are permitted and can obtain insight into the structure of peptides. The scene on the right is the Ramachandran plot of ribonuclease H. |
==Secondary structure plot regions== | ==Secondary structure plot regions== | ||
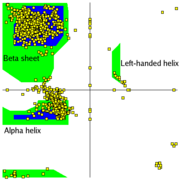
| - | Secondary structures of a peptide are segments of the peptide that have ordered and repetitive structure, and the repetitive structure is due to a repetitive conformation of the residues and, ultimately, repetitive values of φ and ψ. | + | Secondary structures of a peptide are segments of the peptide that have ordered and repetitive structure, and the repetitive structure is due to a repetitive conformation of the residues and, ultimately, repetitive values of φ and ψ. The different secondary structures can be distinguished by their range of φ and ψ values with the values of different secondary structures mapping to different regions of the Ramachandran plot. Two common examples of secondary structure are illustrated below. |
=== α-helix === | === α-helix === | ||
The <scene name='Ramachandran_Plots/Helix_first/1'>scene on the right</scene> shows the axis of the α-helix rotating in the y-plane. When viewing the helix on end, observe the open center of the helix. <scene name='Ramachandran_Plots/Helix_planes/2'>Planes</scene> are drawn on some of the peptide bonds to emphasize that in an α-helix the planar peptide bonds rotate about the axis of the helix. The <scene name='User:Karl_Oberholser/Ramachandran_Plots/Plot1/3'>Ramachandran plot</scene> of this peptide has points clustered about the values of φ= -57<sup>o</sup> and ψ= -47<sup>o</sup> which are the average values for α-helices. <scene name='38/381225/Plot2/4'>Adding the values</scene> of two other helical segments demonstrates that data from all three appear in one large cluster and that the helical segments can not be distinguished by the differences in their φ and ψ values. | The <scene name='Ramachandran_Plots/Helix_first/1'>scene on the right</scene> shows the axis of the α-helix rotating in the y-plane. When viewing the helix on end, observe the open center of the helix. <scene name='Ramachandran_Plots/Helix_planes/2'>Planes</scene> are drawn on some of the peptide bonds to emphasize that in an α-helix the planar peptide bonds rotate about the axis of the helix. The <scene name='User:Karl_Oberholser/Ramachandran_Plots/Plot1/3'>Ramachandran plot</scene> of this peptide has points clustered about the values of φ= -57<sup>o</sup> and ψ= -47<sup>o</sup> which are the average values for α-helices. <scene name='38/381225/Plot2/4'>Adding the values</scene> of two other helical segments demonstrates that data from all three appear in one large cluster and that the helical segments can not be distinguished by the differences in their φ and ψ values. | ||
Revision as of 21:57, 31 January 2023
This page, as it appeared on November 30, 2010, was featured in this article in the journal Biochemistry and Molecular Biology Education.
| |||||||||||
Other entries in Proteopedia
Interactive Ramachandran plots can be generated for any entry in Proteopedia with the use of a typed Jmol command[7]:
- For example, in a new browser window open the entry in Proteopedia for 1bhl
- If the JSmol panel shows a "Displaying simplified model" message, click on the "load full" orange button below it. Once the model is reloaded,
- Right-click on an empty space of the JSmol panel showing the 3D structure on the page, or click on the JSmol logo (or frank) in the bottom right corner.
- When the menu comes up, select
Console - Click in the lower text panel of the console that comes up and type the command
Ramachandran, followed by the return key. - After some processing the Ramachandran plot will be visible and you can hover over and click on the points in the plot just as you can with atoms in a Jmol scene window. (To return to the model, an easy solution is to reload the page or open a new browser instance of that page, or enter into the console
model 1.1.) With the console window open, the values will be listed as you click on the spheres. - To limit the plot to displaying certain residues or portions of the structure, you can issue commands in the console, such as
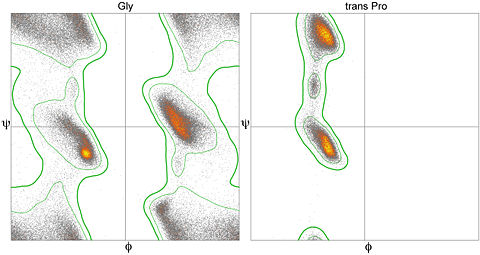
display helixordisplay gly. The latter command will limit the plotted display to just glycine residues. In order to return to showing all values on the plot, issue the commanddisplay allin the Jmol console.
This method to generate interactive Ramachandran plots will also work for other instances of the Jmol applet / JSmol object elsewhere on the web as long as the version of the J(S)mol is 11.4 or greater.
If you just need to report φ and ψ values for a few residues, use the Scene Authoring Tools to select the residues of interest and enter the command draw RAMACHANDRAN in the console.
Notes
- ↑ Ramachandran GN, Ramakrishnan C, Sasisekharan V (July 1963). "Stereochemistry of polypeptide chain configurations". J. Mol. Biol. 7: 95–9. PMID 13990617
- ↑ Lovell SC, Davis IW, Arendall WB 3rd, de Bakker PI, Word JM, Prisant MG, Richardson JS, Richardson DC. Structure validation by Calpha geometry: phi,psi and Cbeta deviation. Proteins. 2003 Feb 15;50(3):437-50. PMID:12557186 doi:10.1002/prot.10286
- ↑ Laskowski,RA, MacArthur,MW, Moss,DS and Thornton,JM (1993) PROCHECK - a program to check the stereochemical quality of protein structures. J. Appl. Cryst., 26, 283–291
- ↑ Lovell SC, Davis IW, Arendall WB 3rd, de Bakker PI, Word JM, Prisant MG, Richardson JS, Richardson DC. Structure validation by Calpha geometry: phi,psi and Cbeta deviation. Proteins. 2003 Feb 15;50(3):437-50. PMID:12557186 doi:10.1002/prot.10286
- ↑ Read RJ, Adams PD, Arendall WB 3rd, Brunger AT, Emsley P, Joosten RP, Kleywegt GJ, Krissinel EB, Lutteke T, Otwinowski Z, Perrakis A, Richardson JS, Sheffler WH, Smith JL, Tickle IJ, Vriend G, Zwart PH. A new generation of crystallographic validation tools for the protein data bank. Structure. 2011 Oct 12;19(10):1395-412. PMID:22000512 doi:10.1016/j.str.2011.08.006
- ↑ Ting D, Wang G, Shapovalov M, Mitra R, Jordan MI, Dunbrack RL Jr. Neighbor-dependent Ramachandran probability distributions of amino acids developed from a hierarchical Dirichlet process model. PLoS Comput Biol. 2010 Apr 29;6(4):e1000763. PMID:20442867 doi:10.1371/journal.pcbi.1000763
- ↑ Command defined at site for official Jmol documentation
See Also
- Dihedral/Index which has links to many tutorials and resources about the Ramachandran principle, and phi and psi angles in proteins.
- Ramachandran Plot in Wikipedia
- Another example of a Ramachandran Plot showing the different regions. at the European Bioinformatics Institute (EBI)
- Basics of Protein Structure
Proteopedia Page Contributors and Editors (what is this?)
Karl Oberholser, Wayne Decatur, Eran Hodis, Jane S. Richardson, Jaime Prilusky, Alexander Berchansky, Angel Herraez, Norbert Sträter, Joel L. Sussman, Shelly Livne, Eric Martz


