This old version of Proteopedia is provided for student assignments while the new version is undergoing repairs. Content and edits done in this old version of Proteopedia after March 1, 2026 will eventually be lost when it is retired in about June of 2026.
Apply for new accounts at the new Proteopedia. Your logins will work in both the old and new versions.
Image:Omar Saleh LigPlot Figure.png
From Proteopedia
(Difference between revisions)
Size of this preview: 452 × 600 pixels
Full resolution (678 × 900 pixel, file size: 165 KB, MIME type: image/png)
Omar Saleh (Talk | contribs)
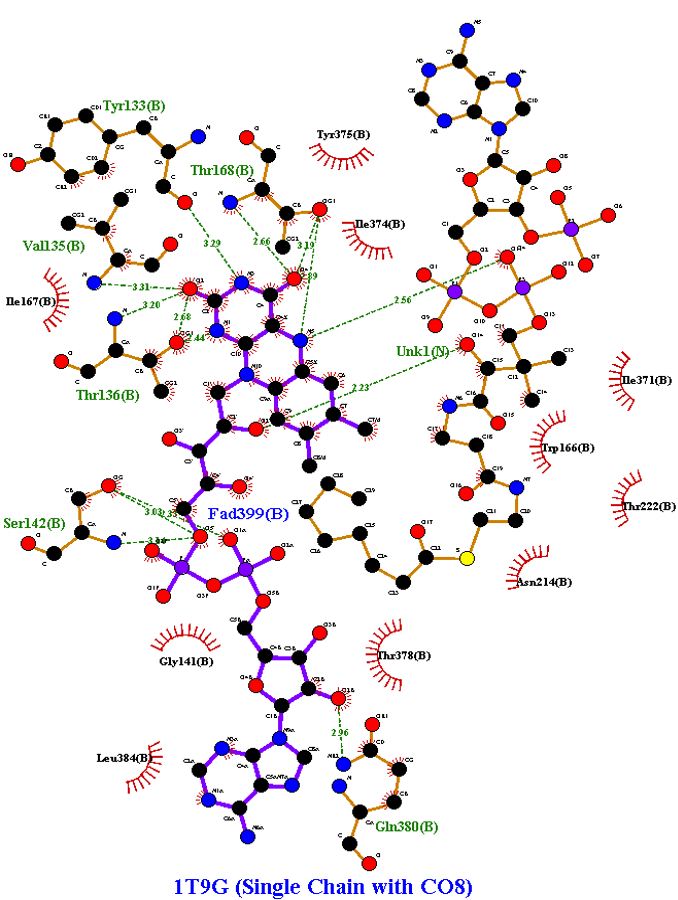
(LigPlot+ results of the computerized-specific 1T9G, with hydrogen bonds shown in olive green, hydrophobic interactions shown in brick red, and UNK as CO8; clarifies Figure of Jmol models A-C.)
Next diff →
Revision as of 22:34, 21 May 2023
Summary
LigPlot+ results of the computerized-specific 1T9G, with hydrogen bonds shown in olive green, hydrophobic interactions shown in brick red, and UNK as CO8; clarifies Figure of Jmol models A-C.
Licensing
| |
File history
Click on a date/time to view the file as it appeared at that time.
| Date/Time | User | Dimensions | File size | Comment | |
|---|---|---|---|---|---|
| (current) | 22:34, 21 May 2023 | Omar Saleh (Talk | contribs) | 678×900 | 165 KB | LigPlot+ results of the computerized-specific 1T9G, with hydrogen bonds shown in olive green, hydrophobic interactions shown in brick red, and UNK as CO8; clarifies Figure of Jmol models A-C. |
- Edit this file using an external application
See the setup instructions for more information.
Links
The following pages link to this file:
