This old version of Proteopedia is provided for student assignments while the new version is undergoing repairs. Content and edits done in this old version of Proteopedia after March 1, 2026 will eventually be lost when it is retired in about June of 2026.
Apply for new accounts at the new Proteopedia. Your logins will work in both the old and new versions.
Image:Bradfordplot.png
From Proteopedia
No higher resolution available.
Bradfordplot.png (629 × 326 pixel, file size: 23 KB, MIME type: image/png)
Gregg T. Holliday (Talk | contribs)
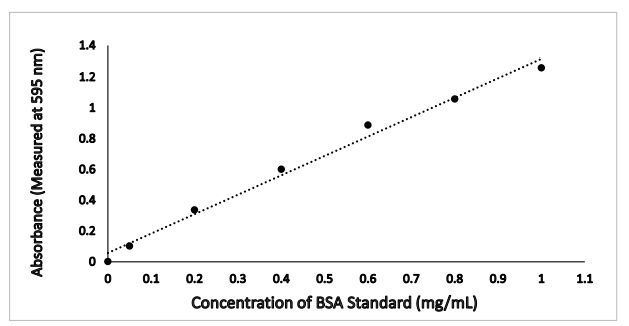
(Microsoft Excel plot of absorbance versus concentration of six BSA standards from Bradford assay. The linear regression was adjusted from a larger data set to provide an appropriate slope intercept equation. The slope intercept equation was calculated b)
Next diff →
Current revision
Microsoft Excel plot of absorbance versus concentration of six BSA standards from Bradford assay. The linear regression was adjusted from a larger data set to provide an appropriate slope intercept equation. The slope intercept equation was calculated by Excel to be y = 1.2613x + 0.0577. The coefficient of determination was calculated by Excel to be R² = 0.9895.
File history
Click on a date/time to view the file as it appeared at that time.
| Date/Time | User | Dimensions | File size | Comment | |
|---|---|---|---|---|---|
| (current) | 17:46, 10 March 2024 | Gregg T. Holliday (Talk | contribs) | 629×326 | 23 KB | Microsoft Excel plot of absorbance versus concentration of six BSA standards from Bradford assay. The linear regression was adjusted from a larger data set to provide an appropriate slope intercept equation. The slope intercept equation was calculated b |
- Edit this file using an external application
See the setup instructions for more information.
Links
The following pages link to this file:
