This old version of Proteopedia is provided for student assignments while the new version is undergoing repairs. Content and edits done in this old version of Proteopedia after March 1, 2026 will eventually be lost when it is retired in about June of 2026.
Apply for new accounts at the new Proteopedia. Your logins will work in both the old and new versions.
Image:MMdata2.png
From Proteopedia
No higher resolution available.
MMdata2.png (602 × 280 pixel, file size: 20 KB, MIME type: image/png)
Gregg T. Holliday (Talk | contribs)
(The plot of approximated velocity versus substrate volume for trial data from the experiment of November 18th, 2022. The trial used eight 200 𝜇𝐿 samples containing 0.000625 mg/mL of 2O14 with PBS buffer, 7.0 pH and 2.0 𝜇𝐿, 6.0 𝜇𝐿, 10.0 �)
Next diff →
Current revision
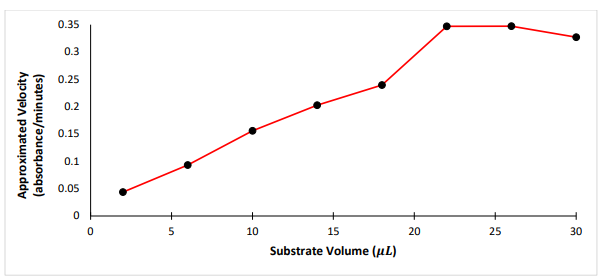
The plot of approximated velocity versus substrate volume for trial data from the experiment of November 18th, 2022. The trial used eight 200 𝜇𝐿 samples containing 0.000625 mg/mL of 2O14 with PBS buffer, 7.0 pH and 2.0 𝜇𝐿, 6.0 𝜇𝐿, 10.0 𝜇𝐿, 14.0 𝜇𝐿, 18.0 𝜇𝐿, 22.0 𝜇𝐿, 26.0 𝜇𝐿, and 30.0 𝜇𝐿 volumes of PNPA. The velocity values were obtained from initial absorbance versus duration of reaction plot from the experiment trial using four minutes’ worth of data points.
File history
Click on a date/time to view the file as it appeared at that time.
| Date/Time | User | Dimensions | File size | Comment | |
|---|---|---|---|---|---|
| (current) | 18:49, 10 March 2024 | Gregg T. Holliday (Talk | contribs) | 602×280 | 20 KB | The plot of approximated velocity versus substrate volume for trial data from the experiment of November 18th, 2022. The trial used eight 200 𝜇𝐿 samples containing 0.000625 mg/mL of 2O14 with PBS buffer, 7.0 pH and 2.0 𝜇𝐿, 6.0 𝜇𝐿, 10.0 � |
- Edit this file using an external application
See the setup instructions for more information.
Links
The following pages link to this file:
