Electrostatic potential maps
From Proteopedia
(→iCn3D) |
(→iCn3D) |
||
| Line 26: | Line 26: | ||
===iCn3D=== | ===iCn3D=== | ||
| + | ====Via FirstGlance in Jmol==== | ||
| + | # [http://firstglance.jmol.org Start FirstGlance in Jmol]. | ||
| + | # Enter the desired [[PDB Id]], such as 1ijw. | ||
| + | # Click the Views tab, then click ''Show More Views''. | ||
| + | # Click ''Electrostatic Potential Map''. | ||
| + | # Click ''Protein'' or ''DNA/RNA''<ref name="bu.au" />. | ||
| + | |||
| + | ====In iCn3D==== | ||
# [https://www.ncbi.nlm.nih.gov/Structure/icn3d/ Start the iCn3D web application]. | # [https://www.ncbi.nlm.nih.gov/Structure/icn3d/ Start the iCn3D web application]. | ||
# Enter the desired [[PDB Id]], such as 1pgb, and click one of the Load buttons<ref name="bu.au">To visualize the differences between the biological unit and asymmetric unit, view the PDB Id in http://firstglance.jmol.org, then click on ''Biological Unit 1''.</ref>. | # Enter the desired [[PDB Id]], such as 1pgb, and click one of the Load buttons<ref name="bu.au">To visualize the differences between the biological unit and asymmetric unit, view the PDB Id in http://firstglance.jmol.org, then click on ''Biological Unit 1''.</ref>. | ||
Revision as of 19:07, 25 August 2024
It is revealing to visualize the distribution of electrostatic charges, electrostatic potential, on molecular van der Waals surfaces. Most protein-protein and protein-ligand interactions are largely electrostatic in nature, via hydrogen bonds and ionic interactions. Their strengths are modulated by the nature of the solvent: pure water or high ionic strength aqueous solution.
Contents |
Gallery
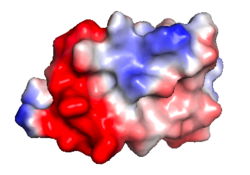
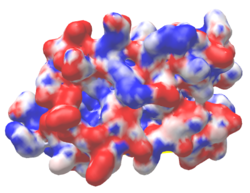
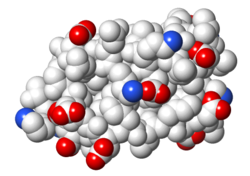
| Protein 1pgb is in the same orientation in all images. Positive + / Negative - | ||
|---|---|---|

| 
| 
|
| Electrostatic potential map rendered by PyMOL using default molecular surface probe radius 1.4 Å. Method. | Electrostatic potential map rendered by iCn3D. | Van der Waals model colored by charge with FirstGlance in Jmol. Sidechain nitrogens on Arg/Lys; oxygens on Asp/Glu. |

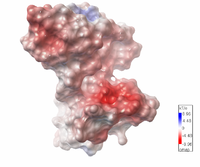
| Electrostatic potential map of 1tsj made with the Embedded Python Molecular Viewer from the Center for Computational Structural Biology of the Scripps Research Institute.
Click on the image to enlarge. |
Methods
iCn3D
Via FirstGlance in Jmol
- Start FirstGlance in Jmol.
- Enter the desired PDB Id, such as 1ijw.
- Click the Views tab, then click Show More Views.
- Click Electrostatic Potential Map.
- Click Protein or DNA/RNA[1].
In iCn3D
- Start the iCn3D web application.
- Enter the desired PDB Id, such as 1pgb, and click one of the Load buttons[1].
- Menu: Select, Defined Sets. In the list that appears, click on proteins (or optionally on nucleotices).
- Menu: Analysis, DelPhi Potential, DelPhi Potential. Click the Surface with Potential tab, then click the button Surface with Potential.
- Menu (optional): Style, Background, White.
To remove the yellow selection halo, enter the command (in the slot at the bottom) "select sets nothing".
PyMOL
PyMOL has a license fee, but is free for students and educators.
- Download and install PyMOL.
- Enter command "fetch 1pgb".
- Menu: All, Action, remove waters.
- Menu: 1pgb, Action, generate, vacuum electrostatics, protein contact potential (local).
- Enter command "bg_color white".
Optional: The probe radius used to generate the molecular surface can be changed, and the previously generated surface will immediately change. The command is "set solvent_radius, 1.2" (don't overlook the comma!).
See Also
- Electrostatic interactions in Proteopedia.
- Jmol/Electrostatic potential methods.
- Isopotential Map in Wikipedia
- Delphi Web Server
References
- ↑ 1.0 1.1 To visualize the differences between the biological unit and asymmetric unit, view the PDB Id in http://firstglance.jmol.org, then click on Biological Unit 1.
