Image:GLP1 helix propensity.PNG
From Proteopedia
(Difference between revisions)
No higher resolution available.
GLP1_helix_propensity.PNG (612 × 190 pixel, file size: 12 KB, MIME type: image/png)
(uploaded a new version of "Image:GLP1 helix propensity.PNG") |
(uploaded a new version of "Image:GLP1 helix propensity.PNG") |
Current revision
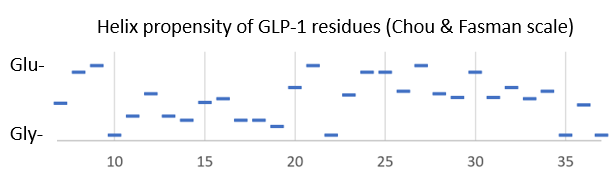
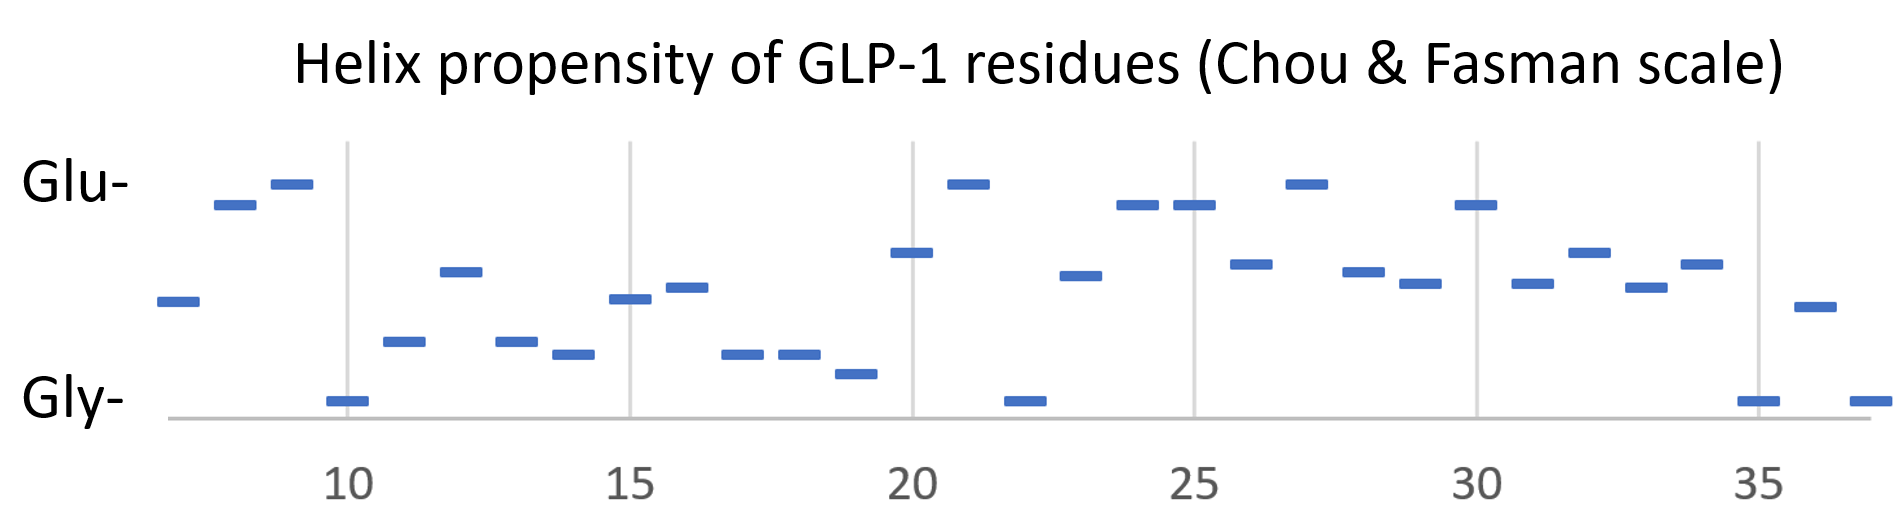
Graph showing the relative helix-propensity (according to the Chou & Fasman scale) of amino acid residues in GLP-1 (7-37). The parameters are taken from https://web.expasy.org/protscale/ and used without averaging over a window. Instead of giving numerical values on the y-axis, the values of the amino acid with highest propensity (Glu) and lowest propensity (Gly) are used to mark the y-axis.
File history
Click on a date/time to view the file as it appeared at that time.
| Date/Time | User | Dimensions | File size | Comment | |
|---|---|---|---|---|---|
| (current) | 20:34, 20 December 2024 | Karsten Theis (Talk | contribs) | 612×190 | 12 KB | |
| 20:32, 20 December 2024 | Karsten Theis (Talk | contribs) | 1899×523 | 47 KB | ||
| 17:24, 20 December 2024 | Karsten Theis (Talk | contribs) | 1899×523 | 47 KB | Graph showing the relative helix-propensity (according to the Chou & Fasman scale) of amino acid residues in GLP-1 (7-37). The parameters are taken from https://web.expasy.org/protscale/ and used without averaging over a window. Instead of giving numerica |
- Edit this file using an external application
See the setup instructions for more information.
Links
The following pages link to this file:
