This is a default text for your page Sandbox3H04. Click above on edit this page to modify. Be careful with the < and > signs.
You may include any references to papers as in: the use of JSmol in Proteopedia [1] or to the article describing Jmol [2] to the rescue.
General Structure and Origins
The total structure weighs 31.41 kDa and the atom count is 2,297. The protein 3H04 usually only occurs in bacteria, specifically staphylococcus aureus subsp. aureus Mu50. Each chain in the protein is about 275 residues long.
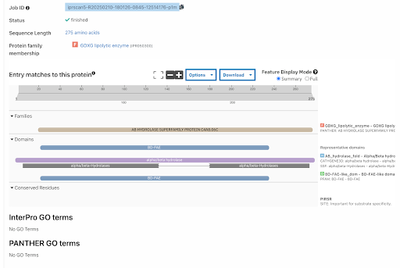
Using InterPro, it can be seen that the protein is found in the alpha-beta hydrolase superfamily.
Family and Superfamily
The family code was BD-FAE under the superfamily of alpha-beta hydrolase.
Structure/Sequence Analysis
Sequence Analysis
SPRITE
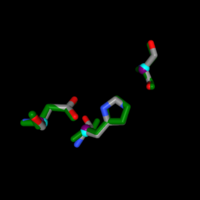
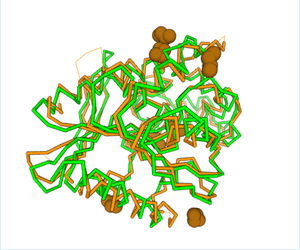
The first structural analysis completed was SPRITE to search the structure of 3H04 for configurations of amino acid side chains with similar structure to known enzyme active sites. Resulting hits occurred with 1a8q Bromoperoxidase A1 with an RMSD of 0.13 that had three amino acid matches. A second match, 1pfp, had an RMSD of 0.15 and three different amino acid matches within the functional group. The overlapped image can be found here to view structure similarity.
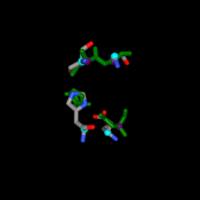
A third match, 1n8o, was viewed with an RMSD of 1.01 and four different amino acid matches within the functional group for better alignment with the overlap shown here.
Chimera
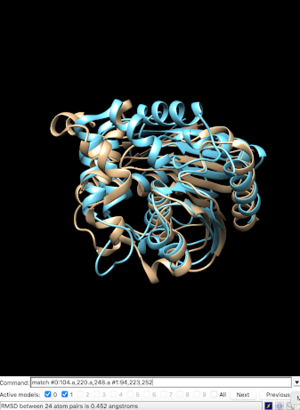
The structural viewing program Chimera was used to view the specific amino acids from SPRITE in the theorized functional group. 1a8q was the primary match used to model matching H304’s 104 serine at 1a8q’s 94, 220 aspartate at 223, and 248 histidine at 252 respectively with a RMSD of 0.452. An overlap was performed to view the functional alignment which can be viewed here.
BLAST
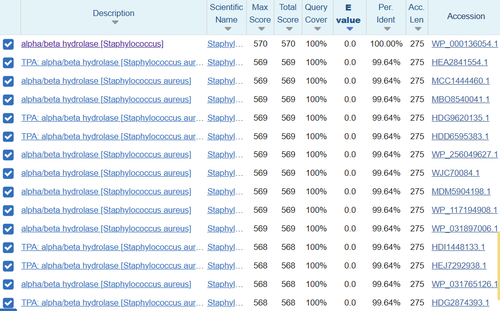
BLAST takes the exact amino acid chain of the protein and runs against a database to view similar sequences which may have similar function. When the chain was inputted into the BLAST software, the results were measured against a “score” showing the significant alignments as well as an E-score which helps show how good of a match it is. The one with the lowest E-score was E. coli MutT with a score of 3 x 10-88, showing that it is a great match. The total score was at the max value with 100% query coverage meaning the sequence was identical. The next several resulting sequences all belonged to Escherichia coli with extremely small E-values and nearly 100% coverage against the 3H04 sequence. The results came from the preliminary search with the MutT line for sequence, however another query was run based upon the PDB sequence which should have more specific results. Again the Escherichia coli appeared with incredible results for Chain A, Nucleoside Triphosphate pyrophosphohydrolase. A third query was used from the RCSB chain for 3H04 “MTEIKYKVITKDAFALPYTIIKAKNQPTKGVIVYIHGGGLMFGKANDLSPQYIDILTEHYDLIQLSYRLLPEVSLDCIIEDVYASFDAIQSQYSNCPIFTFGRSSGAYLSLLIARDRDIDG-VIDFYGYSRINTEPFKTTNSYYAKIAQSINETMIAQLTSPTPVVQDQIAQRFLIYVYARGTGKWINMINIADYTDSKYNIAPDELKTLPPVFIAHC-NGDYDVPVEESEHIMNHVPHSTFERVNKNEHDFDRRPNDEAITIYRKVVDFLNAITMV” which received a top hit of alpha/beta hydrolase [Staphylococcus] with a max score of 570, query coverage of 100%, and E-value of approximately 0.0. The result was incredible because it showed this is exactly where 3H04 arose based on the E-value and gave solid evidence that alpha/beta hydrolase was the function of 3H04.
Structure Analysis
DALI
DALI was used to overlay an entire protein and look at similarity between both proteins. A high Z-score is desired to show the quality of alignment to the query and a high %id as a report of sequence identity between the structures. The first match was 2qruA with a Z-value of 32.5 and 27% id however the protein is also uncharacterized which does not assist in a proposed function. The second match 8q03-B had a Z-value of 25.9 and an %id of 19%. The section originates from ORF30 which had other high quality matches suggesting a pattern. ORF30 is short for Gene 30 protein which is researched and known as human herpesvirus 8 with an alpha/beta hydrolase fold-3 domain-containing pro. This suggests a function to our unknown 3H04 and a possible location where the protein can be found.
InterPRO
InterPRO allows the user to interpret the family that the protein is a part of. First, the aforementioned sequence was obtained via RCSB. This sequence was then plugged into the software and the superfamily listed was an alpha-beta hydrolase superfamily. In terms of the family, this protein is listed under the lipolytic enzyme family. The domain that is listed is BD-FAE as seen in image below.
SwissDock
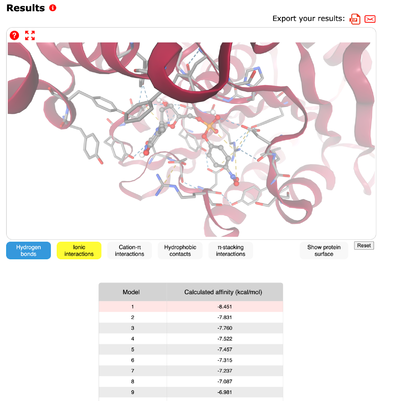
The SwissDock software enables the visualization of what ligands would fit best with the structure of the protein. This is determined by looking at the “calculated affinity” for each of the ligands in a static setting. The strongest match for 3H04 was p-Nitrophenyl thymidine-5'-monophosphate with a very high affinity of -8.451 kcal/mol. Other matches occurred with leucine P-nitro with an affinity of -6.505 kcal/mol, mannobiose with -6.669 kcal/mol, PNP Alpha D Glucopyranoside with -7.089 kcal/mol, and PNP N Acetyl beta D glucosaminide with -6.955 kcal/mol. All results showed similar structures with the ability to be cleaved.
Proposed Functionality
The proposed functionality is based upon multiple computer-based analysis and experimental data. There were several different matches overall, however all of them had the same general function of alpha-beta hydrolase. The connection to 3H04 and alpha-beta hydrolase will be explored more in the following sections.
Hypothetical Function
The hypothetical function of 3H04 is an alpha-beta hydrolase. It is proposed that the protein has enzymatic capabilities in connection with human herpesvirus 8. The protein would be coded in gene 30 with individuals with positive tests for the virus.
Substrates and Docking Analysis
The highest affinity substrate that was found using SwissDock modeling was p-Nitrophenyl thymidine-5'-monophosphate which had a binding affinity of -8.451 kcal/mol. The results made sense with the superfamily being alpha-beta hydrolase from InterPRO and the substrate being readily cleavable. DALI supports the hypothesized function with almost all results being alpha-beta hydrolases. The final largest support of the hypothetical function is BLAST which had a perfect match from ORF30 which has been research as an alpha-beta hydrolasefold-3 domain-containing pro found in human herpesvirus 8.
Experimental Data
Overview
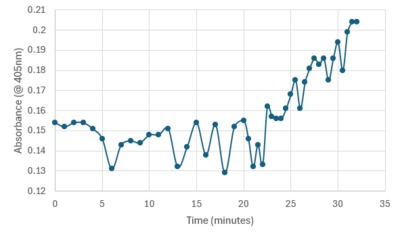
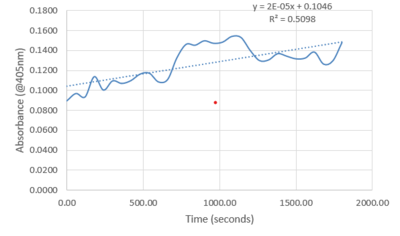
Protein Purification was the first step in getting to a point of experimental data. The protein was grown in E. coli solution that had been tagged with an antibiotic resistance to isolate the protein. The pellet was then lysed with a buffer and sonicated to break up the sample. The resulting sample was centrifuged and the liquid was collected and placed into a separatory column to gather elutions. All steps had portions that were taken throughout to view where the protein was best concentrated. The first experimental occurred from a Bradford assay of known standards to determine which elution had the highest concentration of protein. (Graph to show elution 1 had highest amount). The second experiment was running the portions through all steps on an SDS-PAGE gel to view the purify and amount of protein. It was determined that the protein had expelled through the wash before the elutions were collected. (Include sds-page here) The wash was used to test enzymatic activity by adding PNPP, a buffer, and protein, then recording the absorbance for around 30 minutes. Testing showed a sharp increase in absorbance from 22 to 32 minutes meaning PNPP was cleaved to produce the increase in intensity. The experiment was run again at body temperature using a well plate reader with similar results but much higher increase in intensity.
Relevance
The basil project was put in place to determine the function of unknown pictured proteins. Having greater knowledge on specific proteins can have pharmaceutical implications on knowing how to inhibit function and block binding sites. The relevance into viewing H304 is that it is likely linked to the human herpesvirus which can affect many individuals. Gaining knowledge into the function allows for targeted inhibition and possibly relief against herpes for the general population with much greater research.
Structural highlights
This is a sample scene created with SAT to by Group, and another to make of the protein. You can make your own scenes on SAT starting from scratch or loading and editing one of these sample scenes.
