From Proteopedia
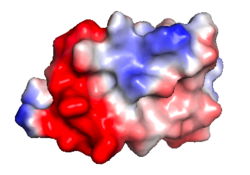
proteopedia linkproteopedia linkIt is revealing to visualize the distribution of electrostatic charges, electrostatic potential, on molecular surfaces. Most protein-protein and protein-ligand interactions are largely electrostatic in nature, via hydrogen bonds and ionic interactions. Their strengths are modulated by the nature of the solvent: pure water or high ionic strength aqueous solution.
Gallery
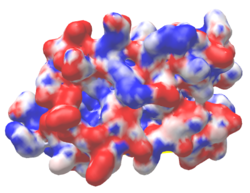
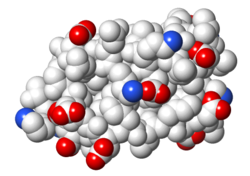
| Protein 1pgb is in the same orientation in all images. Positive + / Negative -
|
| 
| 
|
| Electrostatic potential map rendered by PyMOL using default molecular surface probe radius 1.4 Å. Method.
| Electrostatic potential map rendered by iCn3D.
| Van der Waals model colored by charge wtih FirstGlance in Jmol. Sidechain nitrogens on Arg/Lys; oxygens on Asp/Glu.
|
Methods
PyMOL
- Enter command "fetch 1pgb".
- Menu: All, Action, remove waters.
- Menu: 1pgb, Action, generate, vacuum electrostatics, protein contact potential (local).
See Also
References


