Image:Kinase bradford graph.PNG
From Proteopedia
No higher resolution available.
Kinase_bradford_graph.PNG (523 × 264 pixel, file size: 35 KB, MIME type: image/png)
Summary
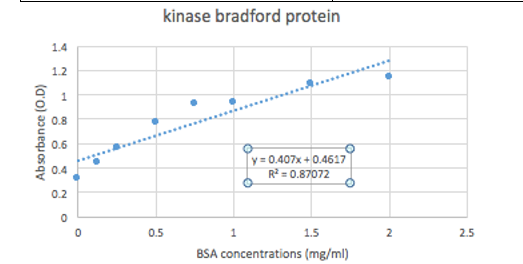
This is a graph of the bradford concentrations. The results for the bradford concentration was 1.1408 mg/ml.
Licensing
{{subst:No license from license selector|Don't know}}
File history
Click on a date/time to view the file as it appeared at that time.
| Date/Time | User | Dimensions | File size | Comment | |
|---|---|---|---|---|---|
| (current) | 17:30, 19 April 2023 | Carmen Almendarez Rodriguez (Talk | contribs) | 523×264 | 35 KB | This is a graph of the bradford concentrations. The results for the bradford concentration was 1.1408 mg/ml. |
- Edit this file using an external application
See the setup instructions for more information.
Links
There are no pages that link to this file.
