Resolution
From Proteopedia
m (→See Also) |
|||
| Line 26: | Line 26: | ||
The images at right were taken from a movie<ref name='movie'>The movie ([[Image:Resolution_holton.mpeg]]) was created by James Holton at the Advanced Light Source of the Berkeley Laboratory at the University of California. Holton kindly gave explicit permission to use this movie in Proteopedia. The original source was http://ucxray.berkeley.edu/~jamesh/movies.</ref> in which the atomic model and electron density map rock back and forth while the resolution value (uncertainty) increases from 0.5 to 5.0 Å. | The images at right were taken from a movie<ref name='movie'>The movie ([[Image:Resolution_holton.mpeg]]) was created by James Holton at the Advanced Light Source of the Berkeley Laboratory at the University of California. Holton kindly gave explicit permission to use this movie in Proteopedia. The original source was http://ucxray.berkeley.edu/~jamesh/movies.</ref> in which the atomic model and electron density map rock back and forth while the resolution value (uncertainty) increases from 0.5 to 5.0 Å. | ||
| + | <center><big> | ||
| + | [http://proteopedia.org/wiki/images/1/1a/Resolution_holton.mpeg '''PLAY MOVIE'''] | ||
| + | </big>(Movie by James Holton at the Advanced Light Source of the Berkeley Laboratory at the University of California<ref name='movie' />.)</center> | ||
| + | <!--COMMENTED OUT BY ERIC MARTZ MAY 15, 2014: I'M NOT SURE WHAT THIS TABLE WAS SUPPOSED TO ACCOMPLISH BUT IT BROKE THE LINK TO THE MOVIE! | ||
<center> | <center> | ||
{| style="float: center; border: 1px solid #BBB; margin: .0em 0 0 0em; width: 250px;" | {| style="float: center; border: 1px solid #BBB; margin: .0em 0 0 0em; width: 250px;" | ||
|- style="font-size: 86%;" | |- style="font-size: 86%;" | ||
| - | | valign="top" |<swf width="300" height="200">http://www.proteopedia.org/wiki/images/e/e7/Resolutionholton.swf</swf> | + | | valign="top" |<swf width="300" height="200">http://www.proteopedia.org/wiki/images/e/e7/Resolutionholton.swf</swf> |
| - | + | <br />Movie by James Holton at the Advanced Light Source of the Berkeley Laboratory at the University of California<ref name='movie' />. | |
|} | |} | ||
| - | </center> | + | </center>--> |
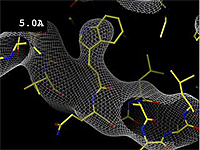
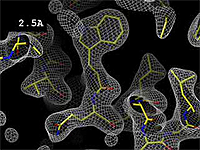
At 0.5 Å in the movie, every atom<ref name="stills" /> of the tryptophan sidechain in the top center of the frame is clearly represented by a sphere of electron density. At 2.5 Å (a bit worse than the median in the [[PDB]]), the overall shape and position of the Trp sidechain is still clear, as is the alpha helical conformation of the main chain. However, at 5.0 Å, only an ill-fitting bump is present to signal the bulky Trp sidechain, and the alpha helix becomes a cylinder of electron density, from which the handedness of the helix may not be discernable. | At 0.5 Å in the movie, every atom<ref name="stills" /> of the tryptophan sidechain in the top center of the frame is clearly represented by a sphere of electron density. At 2.5 Å (a bit worse than the median in the [[PDB]]), the overall shape and position of the Trp sidechain is still clear, as is the alpha helical conformation of the main chain. However, at 5.0 Å, only an ill-fitting bump is present to signal the bulky Trp sidechain, and the alpha helix becomes a cylinder of electron density, from which the handedness of the helix may not be discernable. | ||
Revision as of 11:03, 15 May 2014
Resolution is an average value for the uncertainty of atomic positions in a crystallographic model. High values for resolution (e.g. 5.0 Å) mean high uncertainty, and low values (e.g. 1.0 Å) mean much less uncertainty. 2.05 Å is the median resolution for X-ray crystallographic results in the Protein Data Bank (43,066 on May 2, 2008).
The uncertainty for each atom is quantitated in its temperature value.
Contents |
Quick Guide
Here is a quick guide for interpreting values of resolution. Think of the values as uncertainty: high values mean high uncertainty, which results from greater disorder in the crystal.
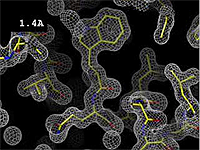
- 1.2 Å Excellent -- backbone and most sidechains very clear. Some hydrogens may be resolved, see Hydrogen in macromolecular models.
- 2.5 Å Good -- backbone and many sidechains clear.
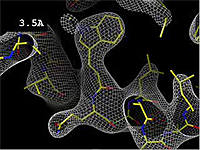
- 3.5 Å OK -- backbone and bulky sidechains mostly clear.
- 5.0 Å Poor -- backbone mostly clear; sidechains not clear.
Electron Density Map vs. Resolution
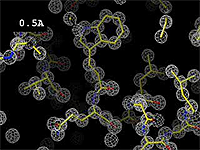
The images at right show how the electron density map[1][2] becomes more accurate and detailed as the uncertainty (resolution value) decreases from 5.0 Å to 0.5 Å.
The images at right were taken from a movie[3] in which the atomic model and electron density map rock back and forth while the resolution value (uncertainty) increases from 0.5 to 5.0 Å.
At 0.5 Å in the movie, every atom[2] of the tryptophan sidechain in the top center of the frame is clearly represented by a sphere of electron density. At 2.5 Å (a bit worse than the median in the PDB), the overall shape and position of the Trp sidechain is still clear, as is the alpha helical conformation of the main chain. However, at 5.0 Å, only an ill-fitting bump is present to signal the bulky Trp sidechain, and the alpha helix becomes a cylinder of electron density, from which the handedness of the helix may not be discernable.
See Also
Websites
- Resolution at ProteinExplorer.Org's Glossary.
Notes
- ↑ Electron density maps are the results of X-ray crystallography experiments.
- ↑ 2.0 2.1 These are "perfect" electron density maps calculated from the atomic model (R factor = 0.0%, perfect phases and amplitudes, contoured at 1 sigma). Electron density maps based on experimental data would fit the true conformation less well. Because these electron density maps were calculated from an atomic model that lacked hydrogen atoms, the electron densities for hydrogen atoms that would appear with experimental data at a resolution of 0.5 Å do not appear.
- ↑ 3.0 3.1 The movie (Image:Resolution holton.mpeg) was created by James Holton at the Advanced Light Source of the Berkeley Laboratory at the University of California. Holton kindly gave explicit permission to use this movie in Proteopedia. The original source was http://ucxray.berkeley.edu/~jamesh/movies.
Proteopedia Page Contributors and Editors (what is this?)
Eric Martz, Joel L. Sussman, Wayne Decatur, Eran Hodis, YongLiang Jiang, Jaime Prilusky
