Journal:Acta Cryst D:S2059798322009755
From Proteopedia
(Difference between revisions)

| Line 21: | Line 21: | ||
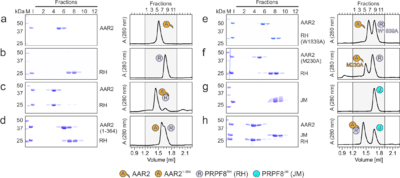
[[Image:Fig2AAR2.png|left|400px|thumb|Figure 2. Probing AAR2Δloop-PRPF8RH interacting regions and residues. (a-h) SDS-PAGE analyses (left) and UV elution profiles (right) of analytical size exclusion chromatography runs monitoring the interactions amongAAR2 variants, PRPF8RH 319 variants and PRPF8JM. Figures a-c were adapted from (Santos et al., 2015)<ref name='Santos'>PMID: 26527271</ref> and are shown for comparison. M, molecular mass standard (kDa); I, input samples. Protein bands are identified on the right. Elution fractions are indicated at the top of the gels and profiles, elution volumes are indicated at the bottom of the profiles. Icons are explained at the bottom. Variants are indicated at the respective icons. Peaks labeled by transparent icons represent an excess of the respective protein.]] | [[Image:Fig2AAR2.png|left|400px|thumb|Figure 2. Probing AAR2Δloop-PRPF8RH interacting regions and residues. (a-h) SDS-PAGE analyses (left) and UV elution profiles (right) of analytical size exclusion chromatography runs monitoring the interactions amongAAR2 variants, PRPF8RH 319 variants and PRPF8JM. Figures a-c were adapted from (Santos et al., 2015)<ref name='Santos'>PMID: 26527271</ref> and are shown for comparison. M, molecular mass standard (kDa); I, input samples. Protein bands are identified on the right. Elution fractions are indicated at the top of the gels and profiles, elution volumes are indicated at the bottom of the profiles. Icons are explained at the bottom. Variants are indicated at the respective icons. Peaks labeled by transparent icons represent an excess of the respective protein.]] | ||
| + | {{Clear}} | ||
| + | |||
| + | [[Image:Fig3aar2a.png|left|400px|thumb|'''Figure 3. Probing AAR2<sup>Δloop</sup>-PRPF8-SNRNP200 interactions and AAR2 phosphorylation.''' | ||
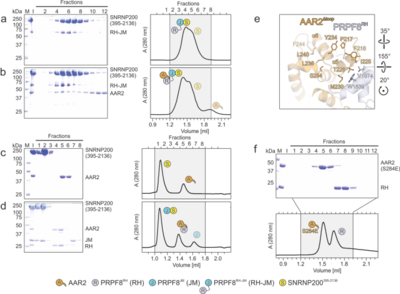
| + | '''(a-d)''' SDS-PAGE analyses (left) and UV elution profiles (right) of analytical size exclusion chromatography runs monitoring the interactions among AAR2, PRPF8<sup>RH-JM</sup> and SNRNP200<sup>395-2136</sup> '''(a, b)''' and among AAR2, PRPF8<sup>RH</sup>, PRPF8<sup>JM</sup> and SNRNP2003<sup>95-2136</sup> '''(c, d)'''. '''(e)''' Close-up view of the region in AAR2<sup>Δloop</sup>-PRPF8<sup>RH</sup> surrounding AAR2<sup>Δloop</sup> S284. The corresponding region in yeast Aar2p is profoundly restructured upon replacement of the equivalent S253 by a phospho-mimetic glutamate residue (Weber et al., 2013)<ref name='Weber'>PMID: 23442228</ref>. (f) SDS-PAGE analysis (top) and UV elution profile (bottom) of an analytical size exclusion chromatography run monitoring the interaction between AAR2 | ||
| + | S284E and PRPF8RH 344 . In panels showing SDS PAGE | ||
| + | 345 gels and elution profiles: M, molecular mass standard (kDa); I, input samples. Protein bands | ||
| + | 346 are identified on the right. Elution fractions are indicated at the top of the gels and profiles, | ||
| + | 347 elution volumes are indicated at the bottom of the profiles. Icons are explained at the bottom. | ||
| + | 348 Variants are indicated at the respective icons. Peaks labeled by transparent icons represent | ||
| + | 349 an excess of the respective protein.]] | ||
{{Clear}} | {{Clear}} | ||
Revision as of 12:14, 26 October 2022
| |||||||||||
This page complements a publication in scientific journals and is one of the Proteopedia's Interactive 3D Complement pages. For aditional details please see I3DC.


