Structural and functional investigation of the human snRNP assembly factor AAR2 in complex with the PRPF8 RNaseH domain
Marco Preussner, Karine F. Santos, Jonathan Alles, Christina Heroven, Florian Heyd, Markus C. Wahl, Gert Weber [1]
Molecular Tour
Most of the metazoan genes are interspersed with non-coding information, so called introns. A large macromolecular machinery in the nucleus, the spliceosome, removes these introns from pre-mRNA transcripts linking the coding exons, to yield functional genes for translation.
(7pjh). In this and the following scenes: AAR2Δloop, orange; PRPF8RH, light blue; a flexible loop (labeled Ser3)[2] of AAR2 connecting its two domains, which in AAR2Δloop was replaced by three serine residues and another smaller flexible loop between residues 313-321 are labeled. N- and C-termini as well as the β-finger module of PRPF8RH are labeled.
in complex with human AAR2Δloop and yeast Aar2p/PRPF8JM (PDB ID 4i43)[3] respectively, to illustrate the human AAR2 in a larger PRPF8 context. In this and the following scenes: Aar2p, maroon; Prp8pRH, dark blue; Prp8pJM, cyan.
(PDB ID 4ilg)[4].
. Water molecules are shown as red spheres. Interacting residues are shown as ball-and-sticks colored by atom type; carbon, as the respective protein; nitrogen, blue; oxygen, red; sulfur, yellow; dashed black lines, hydrogen bonds or salt bridges.
.
.
.
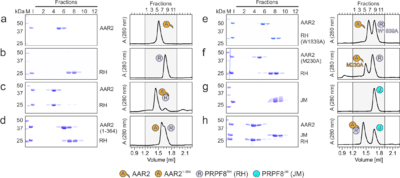
Figure 2. Probing AAR2Δloop-PRPF8RH interacting regions and residues. (a-h) SDS-PAGE analyses (left) and UV elution profiles (right) of analytical size exclusion chromatography runs monitoring the interactions amongAAR2 variants, PRPF8RH 319 variants and PRPF8JM. Figures a-c were adapted from (Santos et al., 2015)
[2] and are shown for comparison. M, molecular mass standard (kDa); I, input samples. Protein bands are identified on the right. Elution fractions are indicated at the top of the gels and profiles, elution volumes are indicated at the bottom of the profiles. Icons are explained at the bottom. Variants are indicated at the respective icons. Peaks labeled by transparent icons represent an excess of the respective protein.
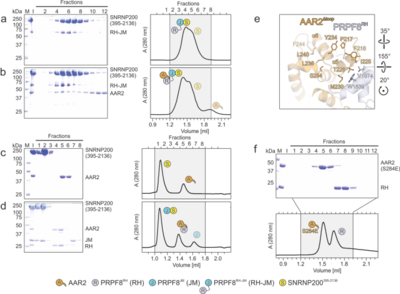
Figure 3. Probing AAR2Δloop-PRPF8-SNRNP200 interactions and AAR2 phosphorylation. (a-d) SDS-PAGE analyses (left) and UV elution profiles (right) of analytical size exclusion chromatography runs monitoring the interactions among AAR2, PRPF8
RH-JM and SNRNP200
395-2136 (a, b) and among AAR2, PRPF8
RH, PRPF8
JM and SNRNP2003
95-2136 (c, d).
(e) Close-up view of the region in AAR2
Δloop-PRPF8
RH surrounding AAR2
Δloop S284. The corresponding region in yeast Aar2p is profoundly restructured upon replacement of the equivalent S253 by a phospho-mimetic glutamate residue (Weber et al., 2013)
[4]. (f) SDS-PAGE analysis (top) and UV elution profile (bottom) of an analytical size exclusion chromatography run monitoring the interaction between AAR2
S284E and PRPF8
RH. In panels showing SDS PAGE gels and elution profiles: M, molecular mass standard (kDa); I, input samples. Protein bands are identified on the right. Elution fractions are indicated at the top of the gels and profiles, elution volumes are indicated at the bottom of the profiles. Icons are explained at the bottom. Variants are indicated at the respective icons. Peaks labeled by transparent icons represent an excess of the respective protein.
. The corresponding region in yeast Aar2p is profoundly restructured upon replacement of the equivalent S253 by a phospho-mimetic glutamate residue [4].
. Close-up views comparing the AAR2Δloop C-terminal tail (sticks) traversing the PRPF8RH domain below the protruding β-finger module (surface views):
- ;
- (PDB ID 4jk7[5]);
- (PDB ID 4jk7). Yellow sphere, coordinated Mg2+ ion. The AAR2 C-terminus clashes with the PRPF8RH domain the step 2 conformation.
The structure and functional data of the human spliceosomal assembly factor Aar2 in complex with a core spliceosomal domain of the PRPF8 protein indicates a different function of human Aar2 in contrast to the yeast protein.
References
- ↑ Preussner M, Santos KF, Alles J, Heroven C, Heyd F, Wahl MC, Weber G. Structural and functional investigation of the human snRNP assembly factor AAR2 in complex with the RNase H-like domain of PRPF8. Acta Crystallogr D Struct Biol. 2022 Nov 1;78(Pt 11):1373-1383. doi:, 10.1107/S2059798322009755. Epub 2022 Oct 27. PMID:36322420 doi:http://dx.doi.org/10.1107/S2059798322009755
- ↑ 2.0 2.1 Santos K, Preussner M, Heroven AC, Weber G. Crystallization and biochemical characterization of the human spliceosomal Aar2-Prp8(RNaseH) complex. Acta Crystallogr F Struct Biol Commun. 2015 Nov;71(Pt 11):1421-8. doi:, 10.1107/S2053230X15019202. Epub 2015 Oct 23. PMID:26527271 doi:http://dx.doi.org/10.1107/S2053230X15019202
- ↑ Galej WP, Oubridge C, Newman AJ, Nagai K. Crystal structure of Prp8 reveals active site cavity of the spliceosome. Nature. 2013 Jan 31;493(7434):638-43. doi: 10.1038/nature11843. Epub 2013 Jan 23. PMID:23354046 doi:http://dx.doi.org/10.1038/nature11843
- ↑ 4.0 4.1 4.2 Weber G, Cristao VF, Santos KF, Jovin SM, Heroven AC, Holton N, Luhrmann R, Beggs JD, Wahl MC. Structural basis for dual roles of Aar2p in U5 snRNP assembly. Genes Dev. 2013 Mar 1;27(5):525-40. doi: 10.1101/gad.213207.113. Epub 2013 Feb, 26. PMID:23442228 doi:10.1101/gad.213207.113
- ↑ Schellenberg MJ, Wu T, Ritchie DB, Fica S, Staley JP, Atta KA, Lapointe P, Macmillan AM. A conformational switch in PRP8 mediates metal ion coordination that promotes pre-mRNA exon ligation. Nat Struct Mol Biol. 2013 May 19. doi: 10.1038/nsmb.2556. PMID:23686287 doi:10.1038/nsmb.2556


