We apologize for Proteopedia being slow to respond. For the past two years, a new implementation of Proteopedia has been being built. Soon, it will replace this 18-year old system. All existing content will be moved to the new system at a date that will be announced here.
Resolution
From Proteopedia
(Difference between revisions)
(explaining images) |
(added movie) |
||
| Line 16: | Line 16: | ||
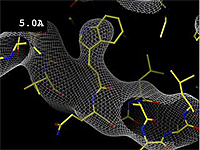
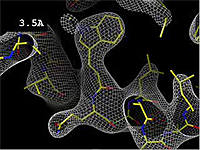
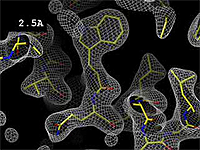
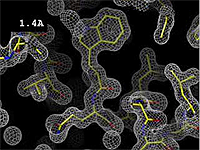
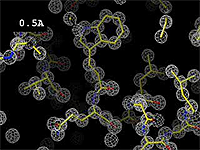
The images at right show how the electron density map<ref>These are "perfect" electron density maps calculated from the atomic model (R factor = 0.0%, perfect phases and amplitudes, contoured at 1 sigma). Electron density maps based on experimental data would fit the true conformation less well. Because these electron density maps were calculated from an atomic model that lacked hydrogen atoms, the electron densities for hydrogen atoms that would appear with experimental data at a resolution of 0.5 Å do not appear.</ref> becomes more accurate and detailed as the uncertainty (resolution value) decreases from 5.0 Å to 0.5 Å. | The images at right show how the electron density map<ref>These are "perfect" electron density maps calculated from the atomic model (R factor = 0.0%, perfect phases and amplitudes, contoured at 1 sigma). Electron density maps based on experimental data would fit the true conformation less well. Because these electron density maps were calculated from an atomic model that lacked hydrogen atoms, the electron densities for hydrogen atoms that would appear with experimental data at a resolution of 0.5 Å do not appear.</ref> becomes more accurate and detailed as the uncertainty (resolution value) decreases from 5.0 Å to 0.5 Å. | ||
| + | |||
| + | The images at right were taken from a [http://proteopedia.org/wiki/images/1/1a/Resolution_holton.mpeg '''Movie''']<ref>The movie ([[Image:Resolution_holton.mpeg]]) was created by James Holton at the Advanced Light Source of the Berkeley Laboratory at the University of California. Holton gave explicit permission to use this movie in Proteopedia. The original source was http://ucxray.berkeley.edu/~jamesh/movies.</ref>. | ||
==See Also== | ==See Also== | ||
Revision as of 23:22, 2 January 2009
Resolution is an average value for the uncertainty of atomic positions in a crystallographic model. High values for resolution (e.g. 5.0 Å) mean high uncertainty, and low values (e.g. 1.0 Å) mean much less uncertainty. 2.05 Å is the median resolution for X-ray crystallographic results in the Protein Data Bank (43,066 on May 2, 2008).
The uncertainty for each atom is quantitated in its temperature value.
The images at right show how the electron density map[1] becomes more accurate and detailed as the uncertainty (resolution value) decreases from 5.0 Å to 0.5 Å.
The images at right were taken from a Movie[2].
See Also
Websites
- Resolution at ProteinExplorer.Org's Glossary.
Notes
- ↑ These are "perfect" electron density maps calculated from the atomic model (R factor = 0.0%, perfect phases and amplitudes, contoured at 1 sigma). Electron density maps based on experimental data would fit the true conformation less well. Because these electron density maps were calculated from an atomic model that lacked hydrogen atoms, the electron densities for hydrogen atoms that would appear with experimental data at a resolution of 0.5 Å do not appear.
- ↑ The movie (Image:Resolution holton.mpeg) was created by James Holton at the Advanced Light Source of the Berkeley Laboratory at the University of California. Holton gave explicit permission to use this movie in Proteopedia. The original source was http://ucxray.berkeley.edu/~jamesh/movies.
Proteopedia Page Contributors and Editors (what is this?)
Eric Martz, Joel L. Sussman, Wayne Decatur, Eran Hodis, YongLiang Jiang, Jaime Prilusky
