Mini Map Aide
From Proteopedia
| Line 16: | Line 16: | ||
Mini Map Aide is meant to be a completely minimal electron density map viewing aid that works on a residue-by-residue basis and could even be used by experimentalists for checking a structure in the final refinement rounds if the user has no computer access for some reason. To this end the bad regions could be recorded, ''e.g.'' by taking screen-shots, for later attention with a dedicated PC-based molecular graphics program, such as [https://www2.mrc-lmb.cam.ac.uk/personal/pemsley/coot/ Coot]. Despite its limitations, the aim is for ''mini map aide'' to be useful in research or as a teaching aid! All of the display calculations are done by a client-side script running in the user's web browser and neither the structure nor the map need to be uploaded to the server. They must, of course, be transferred to the phone beforehand by one or other means! | Mini Map Aide is meant to be a completely minimal electron density map viewing aid that works on a residue-by-residue basis and could even be used by experimentalists for checking a structure in the final refinement rounds if the user has no computer access for some reason. To this end the bad regions could be recorded, ''e.g.'' by taking screen-shots, for later attention with a dedicated PC-based molecular graphics program, such as [https://www2.mrc-lmb.cam.ac.uk/personal/pemsley/coot/ Coot]. Despite its limitations, the aim is for ''mini map aide'' to be useful in research or as a teaching aid! All of the display calculations are done by a client-side script running in the user's web browser and neither the structure nor the map need to be uploaded to the server. They must, of course, be transferred to the phone beforehand by one or other means! | ||
| + | |||
| + | The map must be in CCP4 format and must either cover the protein molecule or fill an entire unit cell. The program should work with most of the maps which are held online in the [[Protein Data Bank]]. The steps of calculating an electron density map on a computer with the [https://www.ccp4.ac.uk/ CCP4 suite] installed are outlined in the online help provided at the [https://minimapai.de/minimaphelp.html mini map aide website]. If the reflection data are available in MTZ format, these may be uploaded to the mini map aide website for conversion to a map file which can then be downloaded to your device and then loaded into the program for display. I am very grateful to Marcin Wodjyr (CCP4/Global Phasing) for allowing me to use the program [https://gemmi.readthedocs.io/en/latest/utils.html#sf2map sf2map] from the [https://joss.theoj.org/papers/10.21105/joss.04200 gemmi suite] on the Mini Map Aide server for this purpose. | ||
| + | |||
| + | |||
<table class="wikitable" align="right"><tr><td width="150"> | <table class="wikitable" align="right"><tr><td width="150"> | ||
Revision as of 21:31, 2 December 2024
The following article was written by Jonathan Cooper, Professor Emeritus at University College, London. (Eric Martz simply put it into Proteopedia, but had no authorship role.)
|
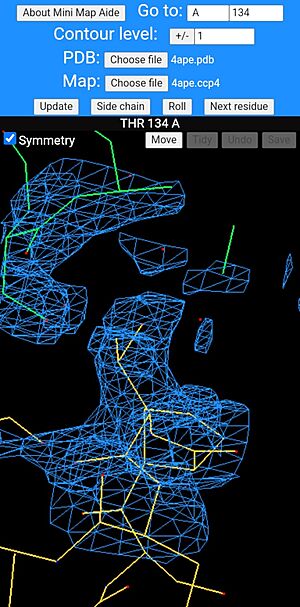
Mini map aide in use showing a threonine residue at the centre of the screen with a symmetry-related molecule, shown with its bonds drawn green. The bonds of main molecule are coloured dark yellow and individual atoms are coloured according to type, red for oxygen and blue for nitrogen. |
Mini Map Aide is a mobile phone website application for visualizing atomic models and electron density maps. It emulates a small number of the functions of FRODO. It is coded in Lua, simply because that was the language that was stored in my head at the time of deciding to do this. Mini Map Aide uses a JavaScript virtual machine Fengari so that it runs as a web-browser script and can use various javascript libraries such as math.js and, most importantly, the 3D graphics library three.js. Quoting from Wikipedia (the free encyclopedia):
"Three.js is a cross-browser JavaScript library and application programming interface (API) used to create and display animated 3D computer graphics in a web browser using WebGL."
WebGL uses OpenGL (Open Graphics Library) which was originally developed by Silicon Graphics in 1991 (see Wikipedia again), when a few of the last remaining PS2s were still in use, although many had been superseded by the higher powered PS300 and PS390 from E&S. I always wanted to dabble in OpenGL, but, as a non-programmer, I was put off several times by the hundreds of lines of code required to do relatively small 3D graphics tasks. Enter three.js which, thankfully, simplifies the task to the point where my interest was finally piqued into some action.
Mini Map Aide is meant to be a completely minimal electron density map viewing aid that works on a residue-by-residue basis and could even be used by experimentalists for checking a structure in the final refinement rounds if the user has no computer access for some reason. To this end the bad regions could be recorded, e.g. by taking screen-shots, for later attention with a dedicated PC-based molecular graphics program, such as Coot. Despite its limitations, the aim is for mini map aide to be useful in research or as a teaching aid! All of the display calculations are done by a client-side script running in the user's web browser and neither the structure nor the map need to be uploaded to the server. They must, of course, be transferred to the phone beforehand by one or other means!
The map must be in CCP4 format and must either cover the protein molecule or fill an entire unit cell. The program should work with most of the maps which are held online in the Protein Data Bank. The steps of calculating an electron density map on a computer with the CCP4 suite installed are outlined in the online help provided at the mini map aide website. If the reflection data are available in MTZ format, these may be uploaded to the mini map aide website for conversion to a map file which can then be downloaded to your device and then loaded into the program for display. I am very grateful to Marcin Wodjyr (CCP4/Global Phasing) for allowing me to use the program sf2map from the gemmi suite on the Mini Map Aide server for this purpose.
|
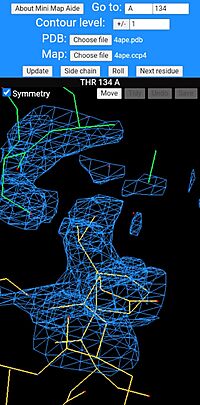
Mini map aide in use showing a threonine residue at the centre of the screen with a symmetry-related molecule, shown with its bonds drawn green. The bonds of main molecule are coloured dark yellow and individual atoms are coloured according to type, red for oxygen and blue for nitrogen. |
See Also
- Molecular visualization in the 1980s where FRODO is described.
- History of Macromolecular Visualization
- X-ray crystallography
- Electron density maps
Content Attribution
This article was written by Jonathan Cooper, Professor Emeritus at University College, London. (Eric Martz simply put it into Proteopedia, but had no authorship role.)


