Molecular visualization in the 1980s
From Proteopedia
The following article was written by Jonathan Cooper, Professor Emeritus at University College, London.
(Eric Martz put it into Proteopedia, but had no authorship role.) |
Contents |
Evans & Sutherland Picture System
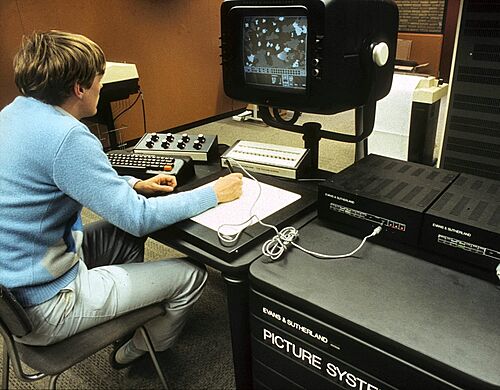
My first encounter with computer graphics being used in a protein crystallography laboratory was in 1984 when a class I was in was shown an Evans and Sutherland (E&S) Picture System 2, or PS2 for short. The display was black-and-white but still it was quite impressive and was one of the things that led me to go into the field as a PhD student. Thus, a year later I had the opportunity to use a colour E&S system, which was appreciably better, for my own research project. It was controlled by a PDP-11/60 which had 128k of RAM while the PS2 itself had 64k of RAM[1].
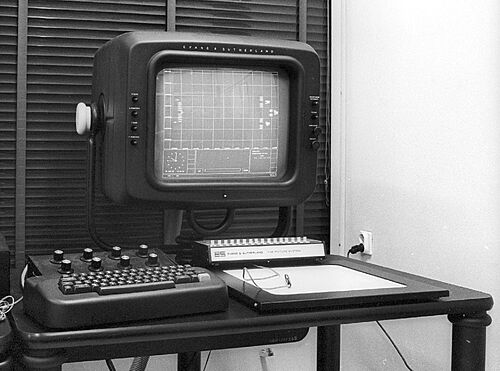
An Evans and Sutherland Picture System 2 (PS2) equipped with a light-pen and dial box. The back of the PDP-11/60 computer cabinet can be seen on the far right. Colour graphic terminals were also available. This photograph is reproduced with the permission of the Museum Waalsdorp, The Hague, Netherlands.
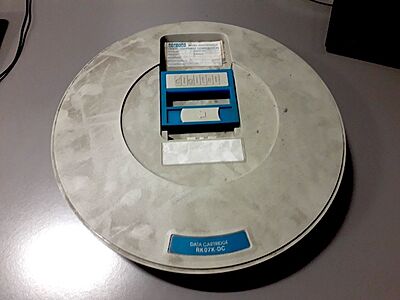
A few years after that, as a post-doc, I had the privilege of being given an RK07 disk cartridge which cost the department the best part of £1000 and allowed me to store almost 30 MB of my own data, rather than begging, borrowing or stealing space on other peoples' disks. These cartridges had to be placed very carefully in one of the PDP-11 disk drives, each of which was about the size of a domestic washing machine, if not larger. The computer alone cost several times the average UK house price, as did the PS2. Although the technology was brand new in its day, these costs do seem rather excessive for a box or two of electronics. I am sure that part of the profit model was to make these machines significantly, but not massively, cheaper than employing the legions of accountants and draftsmen which they would come to replace in the commercial sector.
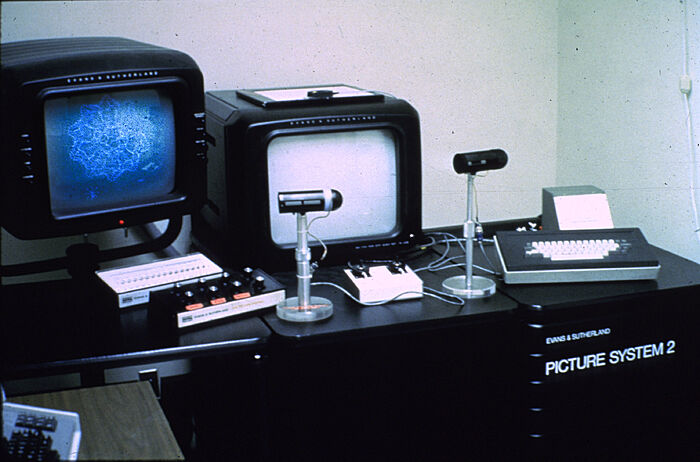
This photo and most of the following explanation were very kindly provided by Prof Thomas Ferrin, Pharmaceutical Chemistry, University of California, San Francisco, showing their system in about 1980. The black cylindrical objects with domed ends are stereo viewers originally made by Bausch and Lomb. They were rotating cylinders that you looked through. They occlude one eye at a time from seeing the screen and their rotation is synchronized with computed left and right eye images. Before the invention of dynamic polarizing lens they were one of the few ways to see stereo images on a calligraphic display.
E&S also marketed a stereo viewer they called the lorgnette. It was based on a rotating disk instead of a rotating cylinder, but otherwise worked in a similar fashion. This photo is the only one showing the E&S mouse (top of the right-hand screen) with which most of the molecular graphics rebuilding work was done.
Data Storage
A photo by the author of a slightly dusty but surviving (as of about 2020) RK07 disk cartridge for the PDP-11/60. These disks only had a capacity of 30 MB so, at most, only a handful of map files could be stored on one of these. Ideally each user would have had one of these to store their work but due to their expense they often provided storage for several group members at once.
Model Building With FRODO
Most crystallographic work was done using the program FRODO which was originally written by Alwyn Jones for a different graphics system[2] and had subsequently been modified to work on the E&S by the program's author and by others over the years. Basically, it reads in the structure of the protein as a PDB file and a contoured version of the electron density map. With the PS2, the molecule on display could be rotated in real time and modified by the user by means of a special E&S mouse (or light pen) on a huge framed mouse pad, known as the tablet.
When looking at a protein structure at the level of individual atoms and bonds, only a small part of the molecule can be displayed at any one time or the image rapidly becomes unintelligible. This difficulty is compounded when an electron density map is being displayed, due to the sheer number of contour lines. The PS2 was a vector-drawing system, *i.e.* the cathode ray tube traced out the individual bonds and map contour lines one-by-one in quick succession and when there were too many to handle, the whole display used to flash bewilderingly. Whilst these problems were substantially solved in the later E&S models, raster graphics would eventually supersede vector graphics systems due to their speed and substantially reduced cost. However, molecular graphics for experimental protein crystallography still mostly involves looking at small volumes of electron density, typically a few Ångstrom units (1 Å is 10-10 m) in each direction. This is something that could almost be done with a mobile phone screen, maybe not for anything very serious, but perhaps to aid the process of finding parts of a protein that need more attention later on with a better appointed computer. Displaying maps on a mobile phone could also be useful for teaching purposes.
FRODO used to run from a constants file which contained the names of the coordinate file and the map file (both held in binary format) as well as the names of several other files including a stereochemical dictionary containing the standard bond lengths and angles for the 20 amino acids as determined by small molecule crystallography. The program allowed the user to make mutations, insertions and deletions as well as rebuilding the amino acids so that they fitted the electron density as well as possible. One could break individual bonds (BOBR option) to separate a fragment e.g. part of a side chain, and you could then translate or rotate it about a chosen atom (FBRT option). However, when a user moves the atoms or groups of atoms, certain bond lengths and angles will immediately begin to deviate from stereochemically acceptable values and this requires that the structure be regularised to confer it with reasonable geometry, as well as retaining a good fit to the electron density. The regularisation in FRODO (via the REFI command) was done with the Hermans and McQueen (1974) algorithm[3] which uses a classical molecular mechanics approach. Rotation of parts of the molecule around torsion angles was also possible with the TOR menu option. The bonds could be rotated smoothly by the use of on-screen sliders which were driven by the mouse or light pen in much the same way as the entire molecule would be rotated for routine inspection of the structure.
Mini Map Aide On A Cell Phone
Whilst most of these old machines have long gone to the great resting place for computers in the sky, no doubt one or two remain in museums or private collections here and there. Given that interpretation of maps relies on looking at small volumes of electron density, it crossed my mind that it might be interesting to try to emulate a small number of the functions of FRODO with a mobile phone. This led me to write Mini Map Aide.
Content Attribution
This article was written by Jonathan Cooper, Professor Emeritus at University College, London. (Eric Martz simply put it into Proteopedia, but had no authorship role. Angel Herráez styled the images with captions.)
See Also
- History of Macromolecular Visualization
- Richards, Frederic M. which describes the optical comparator ("Fred's Folly"), a mechanical/optical device used to build physical models from electron density maps in the 1970s, before capable computers were available.
- Mini Map Aide, a cell phone app for visualizing electron density maps.
References
- ↑ Taylor, G., 1982, Computer graphics at Birkbeck. Information Quarterly for Protein Crystallography (Daresbury Laboratory, Warrington), 8:23-36.
- ↑ Jones, T. A., 1978, A graphics model building and refinement system for macromolecules. J. Appl. Crystallogr. 11, 268-272. DOI 10.1107/S0021889878013308.
- ↑ Hermans, J. and J. E. McQueen, 1974, Computer manipulation of (macro)molecules with the method of local change. Acta Crystallogr. A 30, 730-739.


