Resolution
From Proteopedia
Resolution, in structure determinations, is the distance corresponding to the smallest observable feature: if two objects are closer than this distance, they appear as one combined blob rather than two separate objects. High numeric values of resolution, such as 4 Å, mean poor resolution, while low numeric values, such as 1.5 Å, mean good resolution.
2.05 Å is the median resolution for X-ray crystallographic results in the Protein Data Bank (88,701 on May 15, 2014). For comparison, the van der Waals diameter of a carbon atom is 3.4-3.7 Å[1], and the length of a covalent carbon-carbon bond is 1.5 Å[1].
If some portions of the macromolecule are less ordered in the crystal than others, these will have a poorer resolution. The "resolution of the crystal" represents the most ordered portions (see Determination of Resolution).
After an electron density map is calculated and refined with a fitted atomic model, an uncertainty of atomic position is calculated for each atom in the model. These single-atom uncertainties are called the B factors or temperature values of the atoms (see Temperature).
Contents |
Quick Guide
Here is a quick guide for interpreting values of resolution.
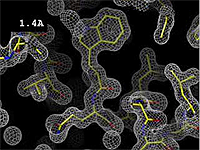
- 1.2 Å Excellent -- backbone and most sidechains very clear. Some hydrogens may be resolved, see Hydrogen in macromolecular models.
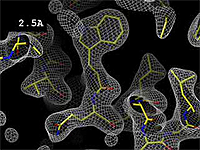
- 2.5 Å Good -- backbone and many sidechains clear.
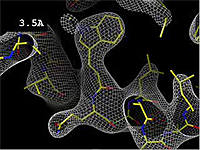
- 3.5 Å OK -- backbone and bulky sidechains mostly clear.
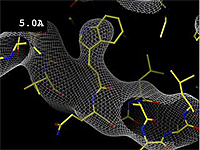
- 5.0 Å Poor -- backbone mostly clear; sidechains not clear.
Confusion of high vs. low resolution
High resolution is characterized by being able to distinguish smaller features, so there is an inverse relationship between the quality of a structure and the length value given for the resolution. For example, a 1.0 Å structure resolves finer detail than a 4.0 Å structure, so the 1.0 Å structure is said to have higher resolution than the 4.0 Å structure. For non-experts, it would be less confusing if the terms were fine and rough resolution rather than high and low resolution, but high and low are the established terms in the field.
What Limits Resolution?
In crystals of macromolecules, it is the degree of order in the crystal ("quality of the crystal") that limits the resolution of X-ray crystallography. Resolution is theoretically limited by the wave length of X-rays (on the order of 1 Å), but in practice, the quality of the available crystals determines resolution. More than half of the crystals obtained from various purified proteins are not of "atomic resolution", that is, the disorder it too great to permit determination of molecular structure. Perhaps the greatest challenge facing crystallographers is to obtain a well-ordered crystal that diffracts to "atomic resolution".
The resolution of a diffraction pattern depends on how ordered the crystal is. If it is highly ordered (atoms are in defined positions throughout the crystal and over time), the crystal will diffract to high resolution. The more disorder there is (atoms moving over time, or the content of one unit cell differing from the next), the lower the resolution of the diffraction image. The intensity of diffraction spots drops with increasing disorder. In order to be able to measure weak reflection spots, it is sometimes possible to increase the intensity of the X-rays used in the experiment, increase the exposure time or sensitivity of the detector, or increase the size of the crystals.
The higher the resolution, the more reflections in the data set. The number of reflections increases with the inverse cube of the resolution, so a 1.0 Å data set has eight times the number of reflection spots present in a 2.0 Å data set.
Electron Density Map vs. Resolution
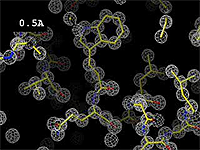
The images at right show how the electron density map[2][3] becomes more accurate and detailed as the resolution value decreases from 5.0 Å to 0.5 Å.
The images at right were taken from a movie[4] in which the atomic model and electron density map rock back and forth while the resolution value (uncertainty) increases from 0.5 to 5.0 Å.
At 0.5 Å in the movie, every atom[3] of the tryptophan sidechain in the top center of the frame is clearly represented by a sphere of electron density. At 2.5 Å (a bit worse than the median in the PDB), the overall shape and position of the Trp sidechain is still clear, as is the alpha helical conformation of the main chain. However, at 5.0 Å, only an ill-fitting bump is present to signal the bulky Trp sidechain, and the alpha helix becomes a cylinder of electron density, from which the handedness of the helix may not be discernible.
Once refinement of the electron density map is completed, the amount of electron density at the position of each atom determines that atom's B factor or temperature value.
Determination of Resolution
The portion of the macromolecule that is best ordered in the crystal is responsible for diffraction spots that are farthest from the axis of the X-ray beam. Resolution is determined from these farthest spots based on their angle θ from the X-ray beam, using the Bragg equation solved for d:
d = λ / (2 sin θ)
where λ is the X-ray wavelength, and d is the smallest distance between crystal lattice planes that scatter discrete spots. The resolution is given by d.
If some portions of the macromolecule are less ordered in the crystal than others, these will have a poorer resolution. The "resolution of the crystal" represents the most ordered portions.
See Also
Within Proteopedia:
External Resources:
Notes
- ↑ 1.0 1.1 See Atomic radii of the elements (Wikipedia), and values from an Inorganic Chemistry textbook.
- ↑ Electron density maps are the results of X-ray crystallography experiments.
- ↑ 3.0 3.1 These are "perfect" electron density maps calculated from the atomic model (R factor = 0.0%, perfect phases and amplitudes, contoured at 1 sigma). Electron density maps based on experimental data would fit the true conformation less well. Because these electron density maps were calculated from an atomic model that lacked hydrogen atoms, the electron densities for hydrogen atoms that would appear with experimental data at a resolution of 0.5 Å do not appear.
- ↑ 4.0 4.1 The movie (Image:Resolution holton.mpeg) was created by James Holton at the Advanced Light Source of the Berkeley Laboratory at the University of California. Holton kindly gave explicit permission to use this movie in Proteopedia. The original source was http://ucxray.berkeley.edu/~jamesh/movies.
Proteopedia Page Contributors and Editors (what is this?)
Eric Martz, Joel L. Sussman, Wayne Decatur, Eran Hodis, YongLiang Jiang, Jaime Prilusky
